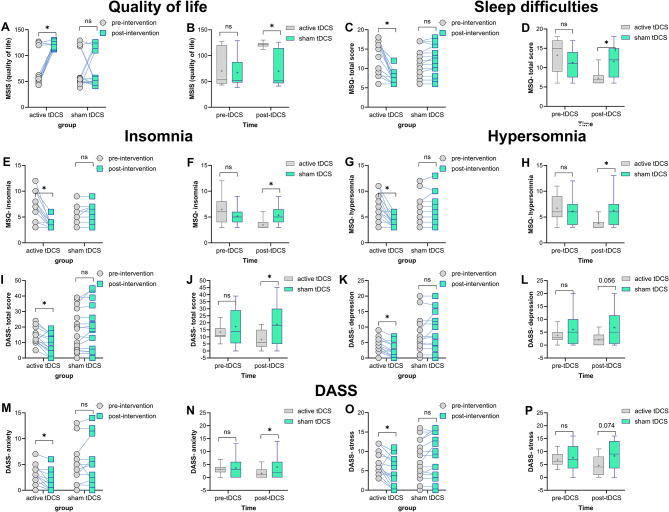
Fig. 3.
Effects of prefrontal active and sham tDCS on mental health variables. The left panel shows average outcome measures before and after the intervention for each group (within-group comparisons), while the right panels depict average measures at each time point (pre- and post-intervention) across groups (active vs. sham). Note: tDCS = transcranial Direct Current Stimulation; DASS = Depression Anxiety Stress Scale. Asterisks [*] in the left panels indicate significant differences between pre- and post-intervention measures in all groups. Asterisks in the right panels signify significant differences between active (1.5 mA) and sham tDCS at each time point. “ns” indicates non-significant results. All pairwise comparisons used Fisher’s LSD multiple comparisons tests, and error bars represent standard error of the mean (s.e.m.)

