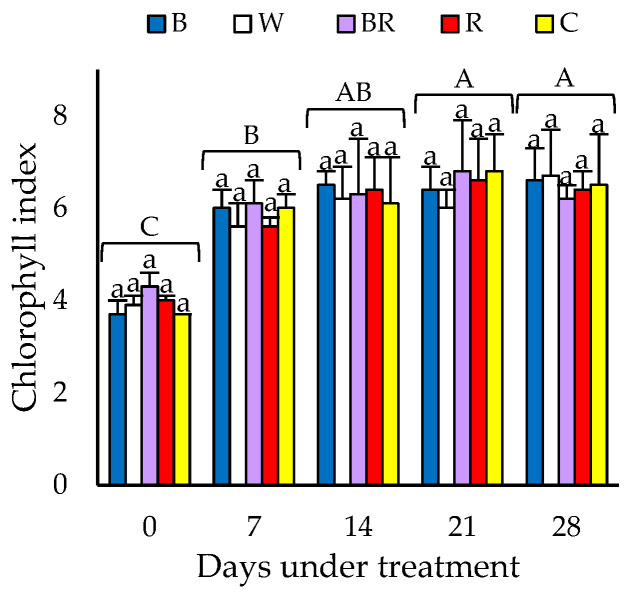
Figure 1.
Relative index of chlorophyll concentration of ‘Levistro’ lettuce plants grown hydroponically under ambient light enriched with different LED light spectra. B (blue; 47:22:21:10; 0.5:1), W (white; 30:38:23:9; 0.8:1), BR (blue-red; 33:15:44:8; 1.3:1), R (red; 16:16:60:8; 3.8:1) and C (control; ambient light; 25:30:31:14; 1.2:1). Different lowercase letters indicate significant differences among light spectra and uppercase letters indicate significant differences between evaluation days by Tukey’s test (p ≤ 0.05). Mean (n = 3) ± SE.

