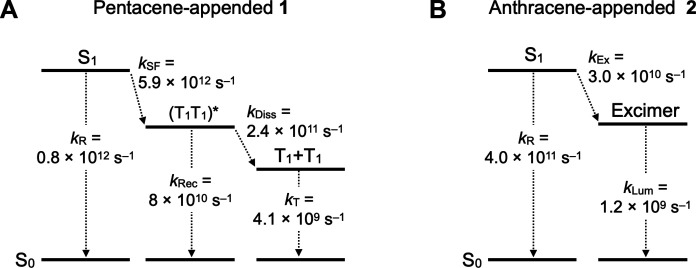
Fig. 6. Excited state dynamics.
Summary of the rate constant for each process from the S1 states of 1 (A) and 2 (B), where kR, kSF, kRec, kDiss, kT, kEx, and kLum are the rate constants for the S1 → S0 transition, SF, (T1T1)* → S0 transition, dissociation of (T1T1)* into T1 + T1, T1 → S0 transition, excimer formation, and excimer → S0 transition, respectively. Because of the time resolution of the instrument, it is difficult to precisely determine rate constants for the SF and S1 → S0 transition, which are very fast processes. Tables S1 and S2 summarize the lifetimes (τ) for each process.

