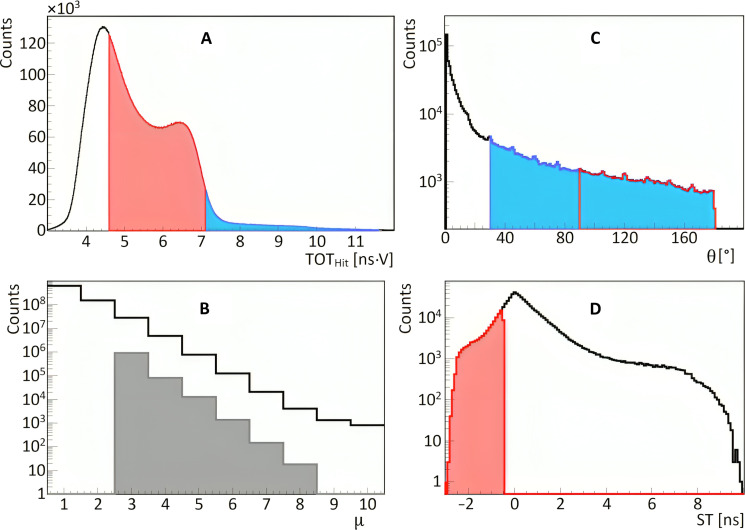
Fig. 7. Event selection criteria for positronium imaging.
(A) Distribution of TOT (TOTHit), used for photon identification. The ranges of TOTHit values for selecting annihilation and deexcitation photons are marked in red and blue, respectively. (B) Distribution of a number of hits in the event (hit multiplicity μ). The gray shadowed histogram shows the hit multiplicity for events including one identified deexcitation photon, two identified annihilation photons, and other possible hits identified as scattered photons. (C) Distribution of the relative angle (θ) between hit position vectors , , ... (defined in Fig. 6A). The figure includes all relative angles in the measured event (θ12, θ23, ...). In the analysis, the relative angle between deexcitation and annihilation photons is restricted to the range marked in blue (θ > 30°), and the red range (θ > 90°) shows the restriction used for the relative angle between annihilation photons. (D) Distribution of the ST value used to suppress misidentification of scattered photons as annihilation photons (indicated in Fig. 8A). For hits assigned to annihilation photons [() and ()], the ST is defined as a difference between the measured times (Δt = ∣ t3 − t2∣) and the time the photon would need to pass from to (ST = ). ST is equal to zero for the scattered photons, while for the annihilation photons, ST is negative. The region used to select events with annihilation photons (ST < − 0.5 ns) is marked in red. Such selection also reduces a large fraction of events due to the accidental coincidences (as indicated in Fig. 8D) that are spread over the whole range of ST.

