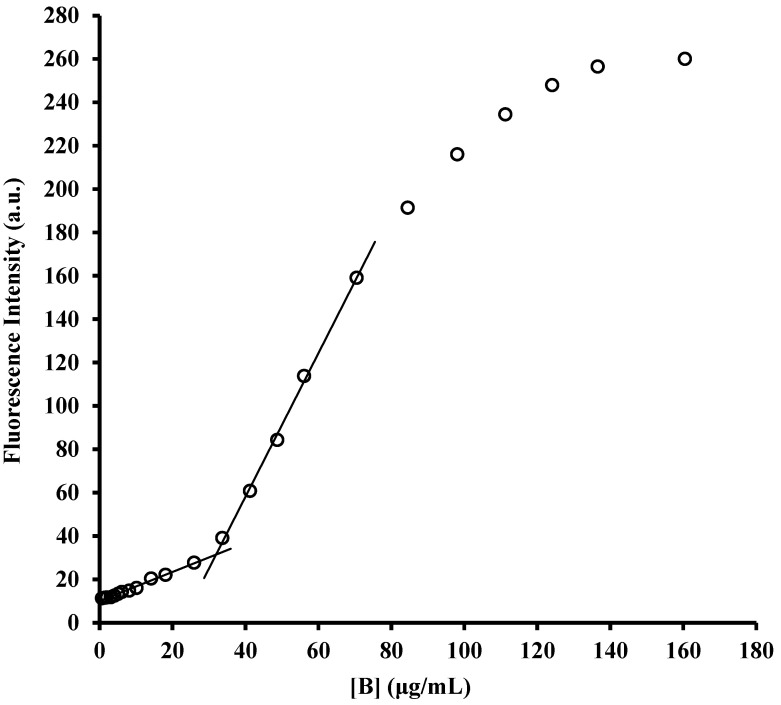
Figure 2.
Determination of critical micellar concentrations by fluorimetric titration. Representative curve of fluorescence as a function of concentration of compound B added to a 1 μM solution of the fluorescent probe N-phenyl-1-naphthylamine (NPN) in 150 mM phosphate buffer solutions (PBS, pH 7.4). CMC was calculated as the intersection point between the two lines traced before and after the increase in fluorescence. CMCs reported in the text are the average results of three tests for each compound.

