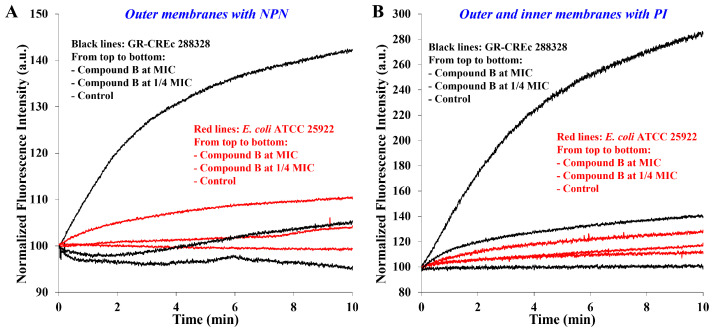
Figure 3.
Variation of normalized fluorescence intensity with time caused by different concentrations of compound B [control (compound B not added), ¼ MIC, MIC] for (A) permeabilization of outer membranes (fluorescent probe: NPN) and (B) permeabilization of both outer and inner membranes (fluorescent probe: PI) in the E. coli ATCC 25922 collection strain (red lines) and in the gentamicin and colistin resistant GR-CREc strain (E. coli 288328, black lines). Data for control and compound B at MIC taken from Ref. [31].

