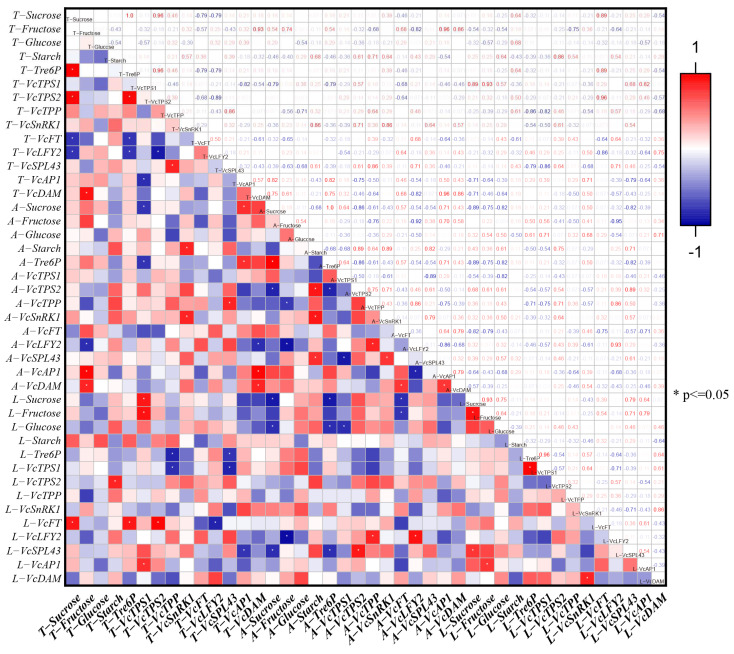
Figure 7.
Correlation analysis of carbohydrate content and related gene expression levels. This is a correlation analysis of carbohydrate content and related gene expression levels between the apical buds, axillary buds, and adjacent leaves during the differentiation process of strong upright spring shoots of blueberries. T, A, and L represent apical buds, axillary buds, and adjacent leaves, respectively. The correlation analysis and significance test were conducted using the Spearman method, and * represents the significance level p ≤ 0.05. The red blocks and numbers represented the positive correlation, while the blue blocks and numbers represented the negative correlation.

