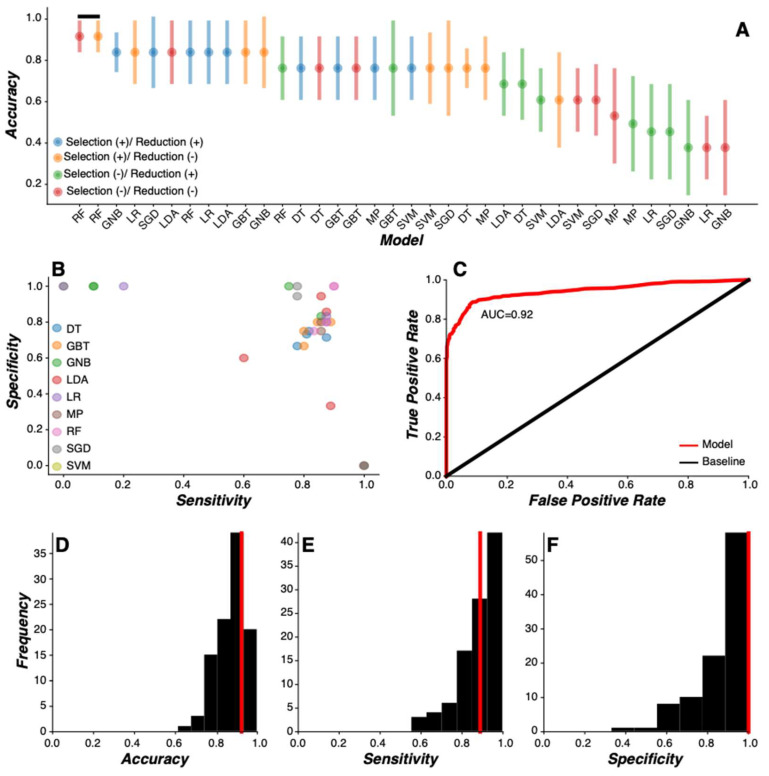
Figure 2.
Machine learning model comparison. (A) Accuracy (median ± IQR) of machine learning model as a function of each model evaluated. Each modeling routine was preceded with (+) or without (−) feature selection and feature reduction routines (see legend). Model classification accuracy was sorted by value and all models with statistically similar classification accuracy values (Wilcoxon signed-rank test) were identified as the optimal models (black line). The random forest model without feature selection or feature reduction routines (red) was the most accurate and parsimonious model. (B) The sensitivity and specificity of each model were plotted as a function of each other. Four values are present for each model, representing the inclusion or exclusion of feature selection and feature reduction routines. (C) The receiver-operator curve (ROC) for the random forest model without feature selection or feature reduction routines across all Monte Carlo simulations (n = 100) showed an area under the curve (AUC) of 0.92 (IQR: 0.85–0.95) in detecting PD status. (D–F) Distribution of model classification accuracy (D), sensitivity (E), and specificity (F) for the random forest model without feature selection or feature reduction routines across all Monte Carlo simulations (n = 100). Median values for each model performance metric (red line) are denoted. (DT = decision tree; GBT = gradient boosted tree; GNB = Gaussian naïve Bayes; LDA = linear discriminant analysis; LR = logistic regression; MP = multilayer perceptron; RF = random forest; SGD = stochastic gradient descent; SVM = support vector machine).

