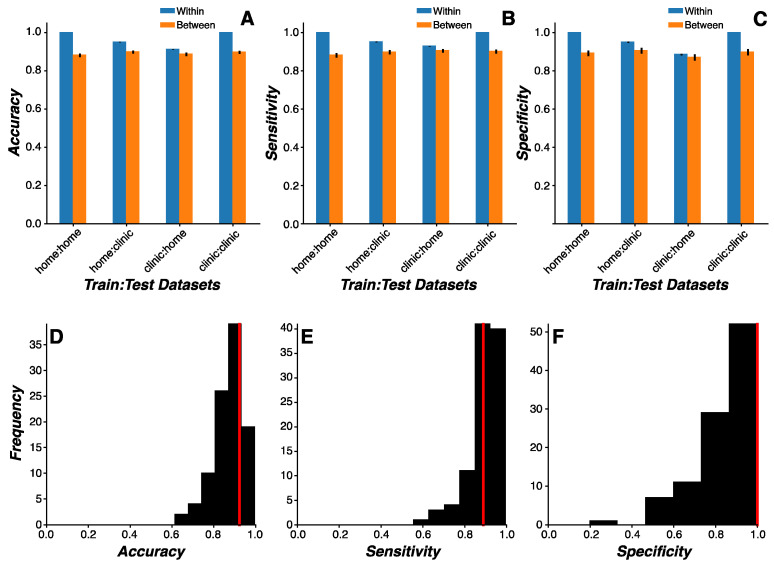
Figure 4.
Cross-environmental learning. (A–C) Mean model classification accuracy (A), sensitivity (B), and specificity (C) for random forest model predictions as a function of training and test environmental contexts (home or clinic) (error bars represent the standard error of the mean). Model predictions were generated for either the same subjects (within; blue bars) or independent subjects (between; orange bars). Classification accuracy was higher when predictions were made on the same relative to independent subjects (p < 0.0001) and when models were trained on home data relative to clinic data (p = 0.0007). When model predictions were made on data generated by independent subjects, no difference in classification accuracy was observed across environmental contexts (p > 0.14). (D–F) Distribution of model classification accuracy (D), sensitivity (E), and specificity (F) for the random forest model trained on clinic data and tested on home data in independent subjects across all Monte Carlo simulations (n = 100). Median values for each model performance metric (red line) are denoted.

