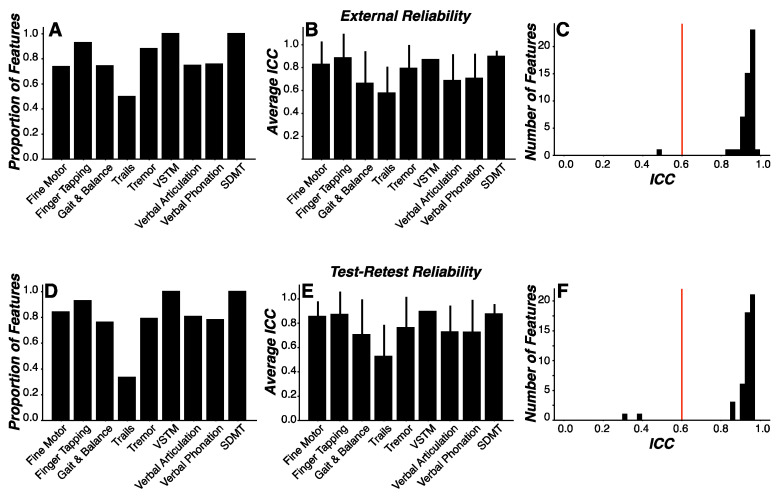
Figure 6.
Feature reliability. (A,B) The external reliability of each feature was evaluated using intraclass correlations (ICC) between the clinic and home measurements. The proportion of features higher than the threshold for moderate ICC values (ICC = 0.6) (A) and mean ICC values (error bars represent the standard error of the mean) across all features (B) were evaluated for each assessment. (C,D) The test-retest reliability of each feature was evaluated using ICC between measurements across all time bins. The proportion of features higher than the threshold for moderate ICC values (ICC = 0.6) (C) and mean ICC values (error bars represent the standard error of the mean) across all features (D) were evaluated for each assessment. (E,F) Distribution of the ICC coefficients, only for features with the highest feature importance values (Figure 3A). ICC coefficients were significantly higher than the threshold (ICC = 0.6; red line) for both external reliability (p < 0.00001; (E)) and test-retest reliability (p < 0.00001; (F)) analyses.

