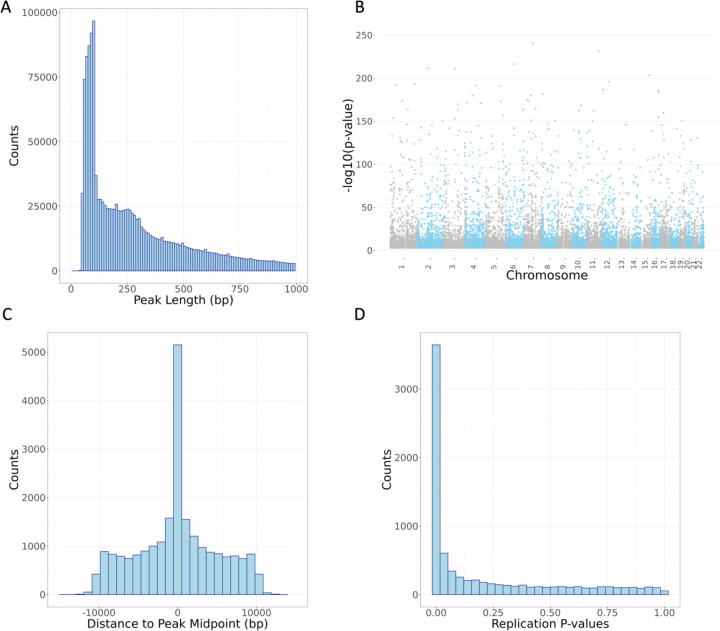
Figure 3. Characteristics of chromatin accessibility peaks and caQTL variants identified in this study.
(A) Distribution of peak length across 1,659,379 called peaks (peaks under 1000 bp shown). (B) Manhattan plot of lead variant for 23,381 caQTL peaks. (C) Distance from lead caQTL variant to midpoint of caQTL peak showing elevation of caQTL variant within the identified chromatin accessibility peak. (D) Lead variants for 23,381 caQTL peaks were matched in external caQTL mapping dataset of African LCLs[49]; p-values from the replication study are plotted here.

