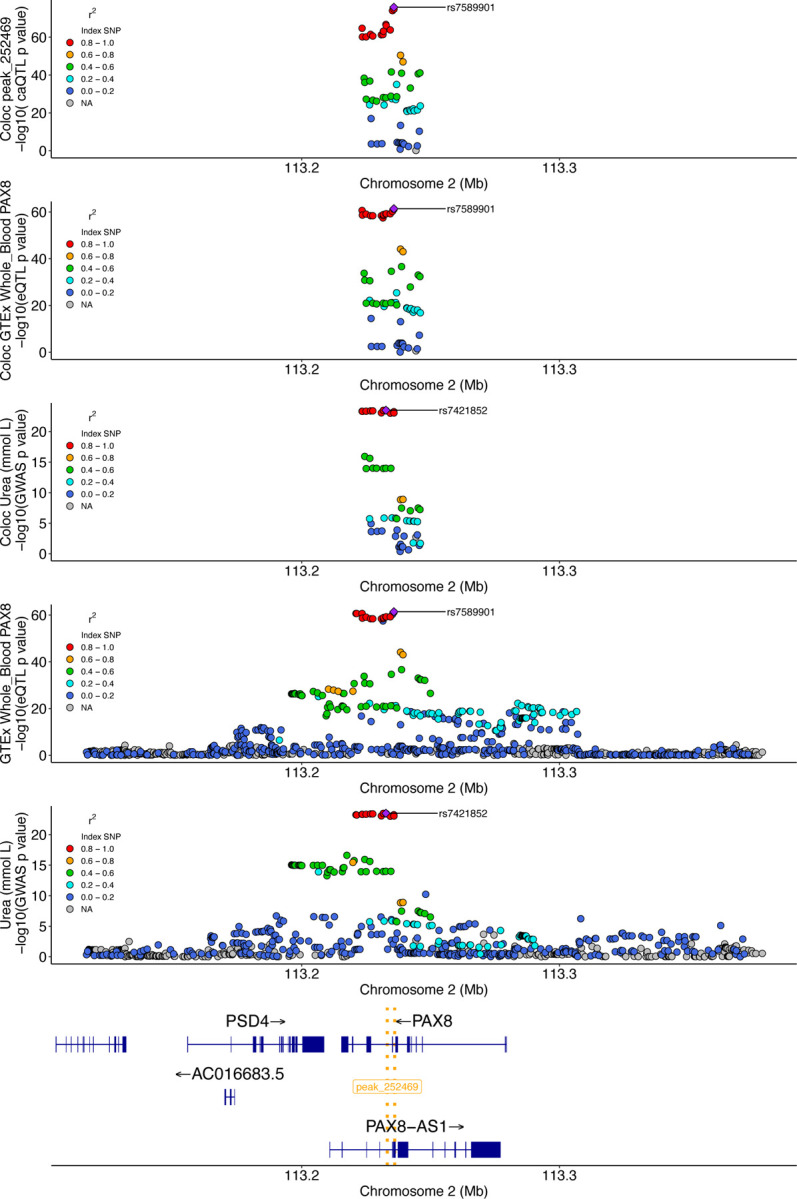
Figure 5. Change in chromatin accessibility and expression implicate PAX8 in serum urea levels.

The top three plots are the colocalization windows (10kb + caQTL peak) for the caQTL, eQTL, and GWAS, respectively. The following two plots are showing a larger window to illustrate the eQTL and GWAS signals, respectively, at this locus at a different scale. The bottom gene track highlights the position of genes at this locus, as well as the location of the caQTL peak (gold dotted lines).
