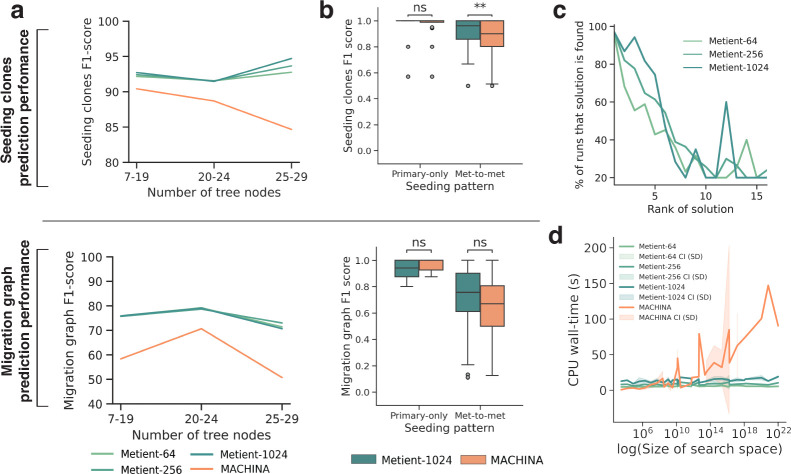
Figure 2. Metient achieves state-of-the-art performance on simulated data.
All results shown for Metient are in calibrate mode using genetic distance as the metastasis prior. Metient-1024 refers to a model configuration where 1024 solutions are sampled. For a given simulated input, for MACHINA (which outputs one solution) the top solution is used, and for Metient we evaluate all top (lowest loss) solutions. (a) The averaged F1-score for predicting seeding clones (top) and migration graph (bottom), within three buckets of input tree sizes. (b) The distribution of F1-scores for predicting seeding clones (top) and migration graph (bottom) on different broad seeding patterns. Statistical significance assessed by a Wilcoxon signed rank test; ns: not significant, **: p=0.0021. (c) After running Metient five times, the percentage of runs that a certain solution is found as a function of its averaged rank across runs. (d) CPU wall-time needed to run Metient vs. MACHINA as a function of the search space size. CI: confidence interval, SD: standard deviation.

