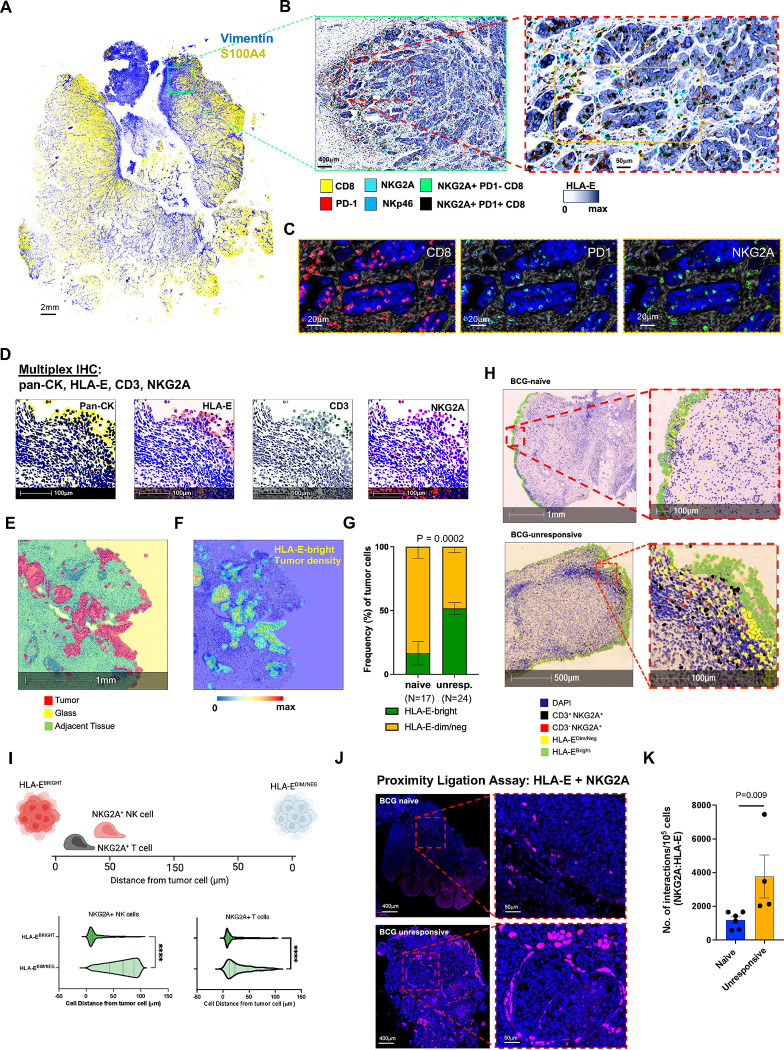
Fig: 2: HLA-E tumor expression is highest when near tumor-infiltrating NKG2A+ NK and CD8 T cells.
A, Representative multiplexed immunofluorescence (IF) analysis by PhenoCycler™ (also known as CODEX) of bladder tumor sections from one patient with BCG-unresponsive NMIBC. Representative staining of the entire section is shown for presence of stroma (vimentin, blue) and tumor (S100A4, yellow). Scale bar indicates 2mm.
B, Magnified inset from Panel A, highlighting tumor HLA-E expression of and use of digital pathology software to identify NKp46+ NK and CD8 T cells with and without co-expression of NKG2A +/− PD-1. Left image scale bar indicates 400μm and right image scale bar indicates 50μm.
C, Magnified inset from Panel B, right image, highlighting individual cells expressing CD8, PD-1, and NKG2A. Scale bars indicate 20μm.
D, Representative multiplexed immunohistochemistry (IHC) of bladder tumor from one patient with BCG-unresponsive NMIBC measuring expression of pan-cytokeratin (pan-CK), HLA-E, CD3, and NKG2A. Scale bar indicates 100μm.
E, Representative digital pathology analyses identifying tumor (red) and adjacent/non-tumor (green) tissue along with exposed areas of glass (yellow) to be excluded from subsequent analyses. Scale bar indicates 1mm.
F, Density map highlighting regions of high HLA-E tumor expression. Blue-red color scale indicates HLA-E expression intensity. Scale bar indicates 1mm.
G, Summary analysis of frequency of tumor cells that are HLA-E-bright (green) and HLA-E-dim/negative (dim/neg, yellow) in BCG-naïve (N=17) and BCG-unresponsive (unresp., N=24) NMIBC tumors.
H, Representative digital pathology analysis on one BCG-naïve (top row) and one BCG-unresponsive (bottom row) NMIBC tumor section highlighting nuclear expression of DAPI (blue) and identification of CD3+NKG2A+ CD8 T cells (black), CD3- NKG2A+ NK cells (red), and tumor cells with bright (green) or dim/negative (yellow) expression of HLA-E.
I, Proximity analysis (N=41) measuring cell distance (0–150μm) from HLA-E-bright and HLA-E-dim/regative tumors by NKG2A+ NK cells (left side) and NKG2A+ T cells (right side). ****, p<0.00001. P-values were assessed via independent two-sided t-test.
J, Representative proximity ligation assay (PLA) using immunofluorescence to profile interactions between HLA-E and NKG2A in one BCG-naïve (top row) and one BCG-unresponsive (bottom row) patient with NMIBC.
K, Summary analysis of PLA measuring interactions between HLA-E and NKG2A. P-values were assessed via independent two-sided t-test.

