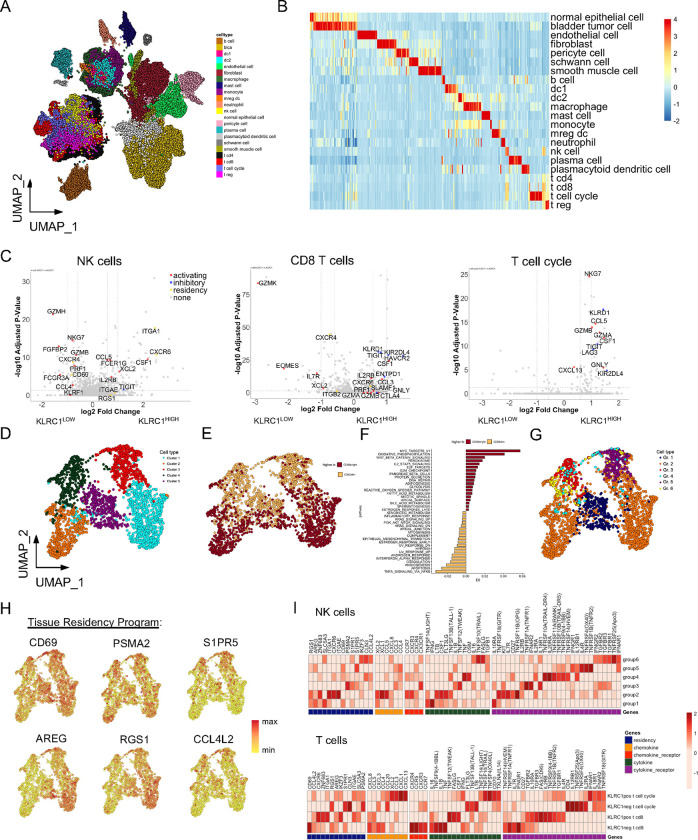
Fig. 3: Single-cell RNA sequencing analysis of NKG2A+ NK and CD8 T cells from bladder tumors reveals strong antitumor potential but with co-expression of inhibitory receptors.
A, UMAP visualization of cell lineages from single-cell RNA sequencing analysis of urothelial tumor samples (N=9, 65,324 cells).
B, Heatmap summary of genes most differentially expressed on each cell lineage identified.
C, Differentially expressed gene (DEG) analysis of bladder tumor-derived NK cells (left), CD8 T cells (center), and proliferating T cell cycle cells (right) when stratified by high versus dim/negative KLRC1 expression.
D and E, UMAP visualizations of bladder tumor-derived NK cells from unsupervised clustering revealing (D) five clusters or (E) expression of NCAM1/CD56 for annotation of CD56BRIGHT and CD56DIM NK cells (N=2,580 cells).
F, Pathway analysis of Hallmark gene networks that are significantly differentially expressed (at least p<0.05) on bladder tumor-derived CD56BRIGHT and CD56DIM NK cells. P-values were determined using a two-sided t-test.
G and H, UMAP visualization of bladder tumor-derived NK cells (G) clustered according to Groups 1–6 defined by Netskar et al. 30 and (H) highlighting expression and distribution of representative tissue residency genes.
I, Heatmap summary showing average expression for genes associated with tissue residency, chemokines, cytokines, and their receptors on bladder tumor-derived Group 1–6 NK cells (top heatmap) and CD8 T cells and T cell cycle cells when stratified according to KLRC1 expression (bottom heatmap).

