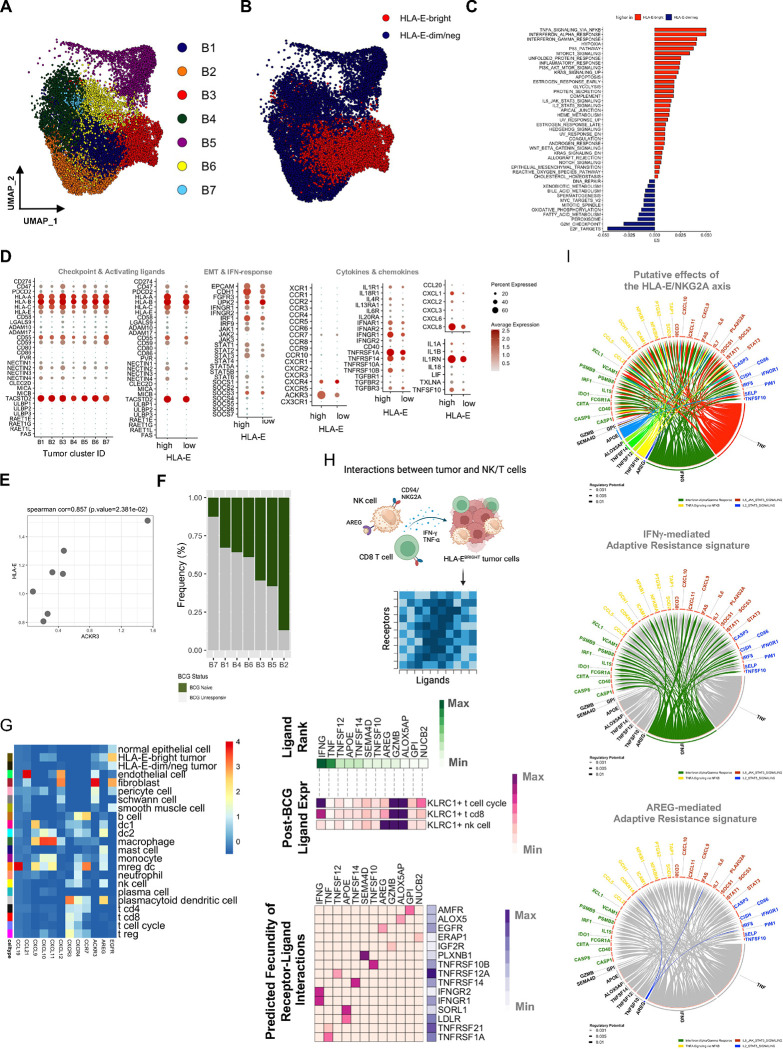
Fig. 4: Single-cell RNA sequencing analysis of bladder tumor cells reveals functional differences that segregate the tumor microenvironment.
A, UMAP visualization of bladder tumor cells from unsupervised clustering revealing seven clusters (B1-B7).
B, UMAP visualization of HLA-E expression defined by tertiles, highlighting the top tertile (red dots) as HLA-E-bright (N=5,461) and bottom tertile (blue dots) as HLA-E-dim/negative (N=9,256) tumor cells.
C, Pathway analysis of Hallmark gene networks that are significantly differentially expressed (at least p<0.05) on HLA-E-bright and HLA-E-dim/negative bladder tumor cells. P-values were determined using a two-sided t-test.
D, Bubble plot showing targeted gene expression across bladder tumor clusters B1-B7 and stratified by HLA-EHIGH or HLA-ELOW tumor clusters. Size of bubble indicates percent of cluster or group and color indicates average gene expression.
E, Scatterplot highlighting pseudobulking of bladder tumor cells and expression of HLA-E and ACKR3 (CXCR7). P-value was determined using a two-sided correlation.
F, Stacked bar plot showing the frequency of bladder tumor clusters, B1-B7 that are identified in BCG-naïve (green) and BCG-unresponsive (grey) NMIBC tumors.
G, Heatmap summary of average gene expression of select chemokines, chemokine receptors, amphiregulin (AREG) and EGFR across all major clusters identified by scRNAseq of bladder tumors (N=9, 65,324 cells).
H, Ligand-receptor interaction analysis of KLRC1HIGH cells (NK cells, CD8 T cells, T cell cycle) and HLA-E-bright tumor cells (schematic diagram at top) showing the top 12 ranked ligands by KLRC1-expressing cells and cognate receptors expressed by HLA-EHIGH tumor cells. Ligand-receptor pairs were selected by rank-ordering and using cut-off weight of 0.2.
I, Circos plot showing top ranked ligands by KLRC1-expressing cells at the bottom and significant genes expressed by HLA-EHIGH tumor cells as a result of ligand-receptor interactions highlighting putative effects of the HLA-E/NKG2A axis (top) or the IFNG-mediated (middle) or AREG-mediated (bottom) resistance signatures.

