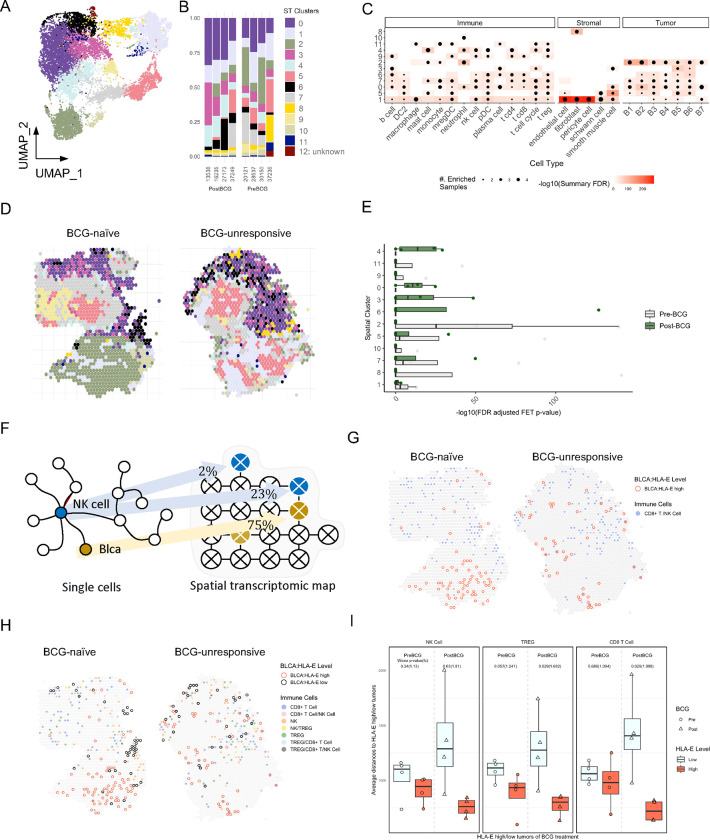
Fig. 5: Spatial analysis of NMIBC tumors reveals an organization within the TME.
A and B, UMAP visualization of spatial transcriptomics sequencing (ST-seq) analysis of BCG-naïve (N=4) and BCG-unresponsive (N=4) NMIBC tumors identifying 12 ST-clusters and their distributions across NMIBC specimens.
C, Bubble plot showing ST-clusters 1–11 (rows) and their relative composition across immune, stromal, and tumor subtypes (columns) as defined by scRNAseq analysis. Size of bubble indicates its relative enrichment and shading of surrounding boxes indicate significance by FDR (corrected p values).
D, Representative ST-seq images showing the distribution of ST-clusters 1–11 in one BCG-naïve (left) and one BCG-unresponsive (right) NMIBC tumor specimens.
E, Summary histogram comparing relative enrichment of each ST-cluster in BCG-naïve (grey, N=4) and BCG-unresponsive (green, N=4) NMIBC tumor specimens.
F, Schematic diagram illustrating deconvolution of NK cells and tumor cells across 10x Visium spots. Cutoff of 20% of spot’s composition was used for defining a true signal.
G and H, Representative ST-seq images from one BCG-naïve (left) and one BCG-unresponsive (right) NMIBC tumor specimens showing proximity analyses of HLA-ELOW (black circles) and HLA-EHIGH (red circles) tumor cells to (G) NK/CD8 T cells (blue spots) or (H) NK cells, CD8 T cells, and Tregs alone or in combination (colored spots).
I, Summary comparisons of proximity of HLA-EHIGH (red bars) and HLA-ELOW (grey bars) tumor cells to NK cells (left), Tregs (middle) and CD8 T cells (right). P-values were determined using two-sided Wilcoxon test.

