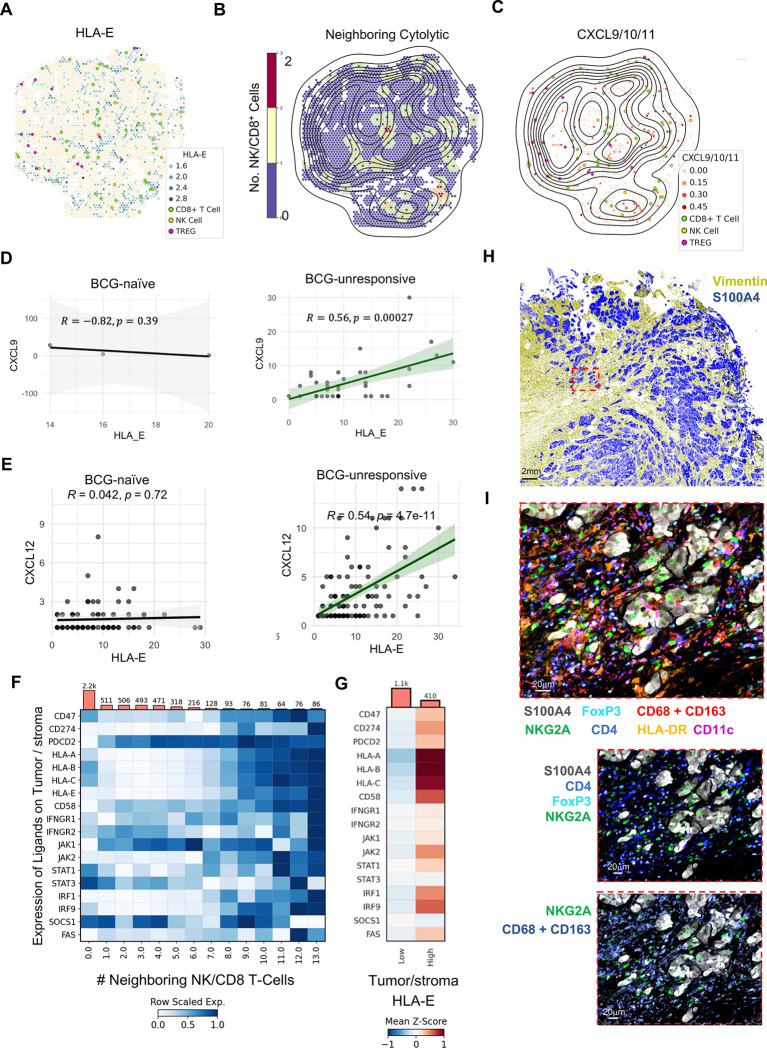
Fig. 6: Recruitment of HLA-EHIGH tumor cells to stromal regions replete with immune infiltration correlates with BCG-unresponsive NMIBC.
A-C, Representative ST-seq images from one BCG-unresponsive NMIBC tumor highlighting (A) proximity of NK cells, CD8 T cells, and Tregs to tumor and stromal cells according to HLA-E expression, (B) overlaid topographical map of HLA-E tumor/stromal cell expression with color indicating abundance of NK and cytolytic CD8 T cells, and (C) proximity of NK cells, CD8 T cells, and Tregs to myeloid cells expressing any combination of CXCL9, CXCL10, and/or CXCL11.
D, Correlation analysis of Visium spots, defined as tumor cell with or without stromal cells, for co-expression of CXCL9 and HLA-E expression in BCG-naïve (N=4, left) and BCG-unresponsive (N=4, right) NMIBC tumor specimens.
E, Correlation analysis of Visium spots, defined as tumor cell with or without stromal cells, for co-expression of CXCL12 and HLA-E expression in BCG-naïve (N=4, left) and BCG-unresponsive (N=4, right) NMIBC tumor specimens.
F, Meta-analysis of all tumor/stroma-labelled Visium spots showing row-scaled expression of pertinent genes stratified by number of neighboring infiltrating NK cells and/or CD8 T-cells.
G, Z-scored heatmap showing HLA-ELOW, low-cytotoxic infiltrating tumor spots (N = 1,200 Visium spots) vs HLA-EHIGH and high-NK/CD8 T cell-infiltrated tumor spots (N = 242 Visium spots).
H, Representative multiplexed IF analysis by PhenoCycler™ of bladder tumor sections from one patient with BCG-unresponsive NMIBC highlighting the presence of stroma (vimentin, blue) and tumor (S100A4, yellow). Scale bar indicates 2mm.
I, Magnified inset from Panel H, highlighting tumor S100A4 expression of and use of digital pathology software to identify NKG2A+ NK and CD8 T cells along FoxP3+ CD4+ Tregs, macrophages (CD68 and CD163) and dendritic cells (CD11c and/or HLA-DR). Image scale bar indicates 20μm.

