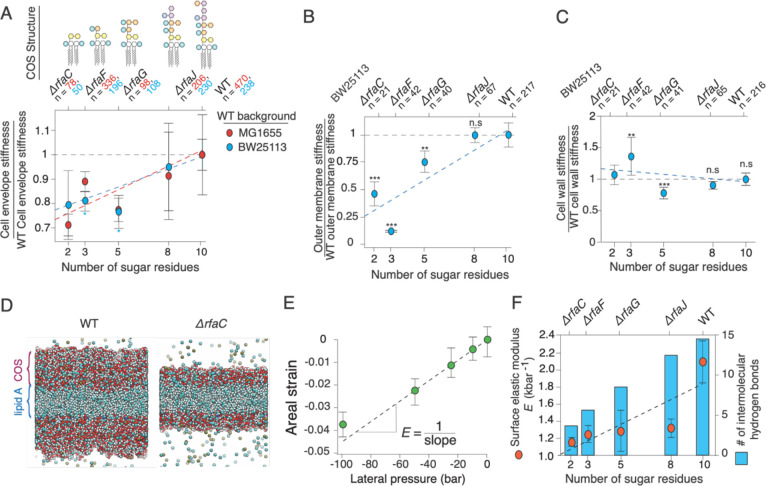
Figure 3. Cell envelope and outer membrane stiffness are proportional to lipopolysaccharide length.
A) Cell envelope stiffness versus core oligosaccharide length, normalized by wild-type cell-envelope stiffness; n = 50, 196, 108, 230, 238 for ΔrfaC, ΔrfaF, ΔrfaG, ΔrfaJ and BW25113 wild-type cells, respectively. Error bars indicate +/− 1 s.d. across 2–3 experiments per mutant. C) Outer membrane stiffness versus core oligosaccharide length, normalized to wild-type outer membrane stiffness; n = 21, 43, 41, 78, 220 for ΔrfaC, ΔrfaF, ΔrfaG, ΔrfaJ and BW25113 wild-type cells, respectively. Most of the core rfa mutants in the MG1655 background lysed when we performed the plasmolysis-lysis assay on them and therefore we could not decouple outer membrane and cell wall stiffness. (D-F) are results from MD simulations. D) Illustration of simulated wild-type lipopolysaccharide bilayer (left) and Δrfac lipopolysaccharide bilayer (right). E) Areal strain versus lateral pressure for the wild-type simulated lipopolysaccharide bilayer. F) (orange circles, left axis) Surface (2-D) elastic modulus versus core oligosaccharide length for simulated lipopolysaccharide bilayers. Error bars indicate +/− 1 s.d. across three 20 ns time-windows after the system had reached its maximum contraction. (blue bars, right axis) Mean number of intermolecular hydrogen bonds at a given time versus core oligosaccharide length.

