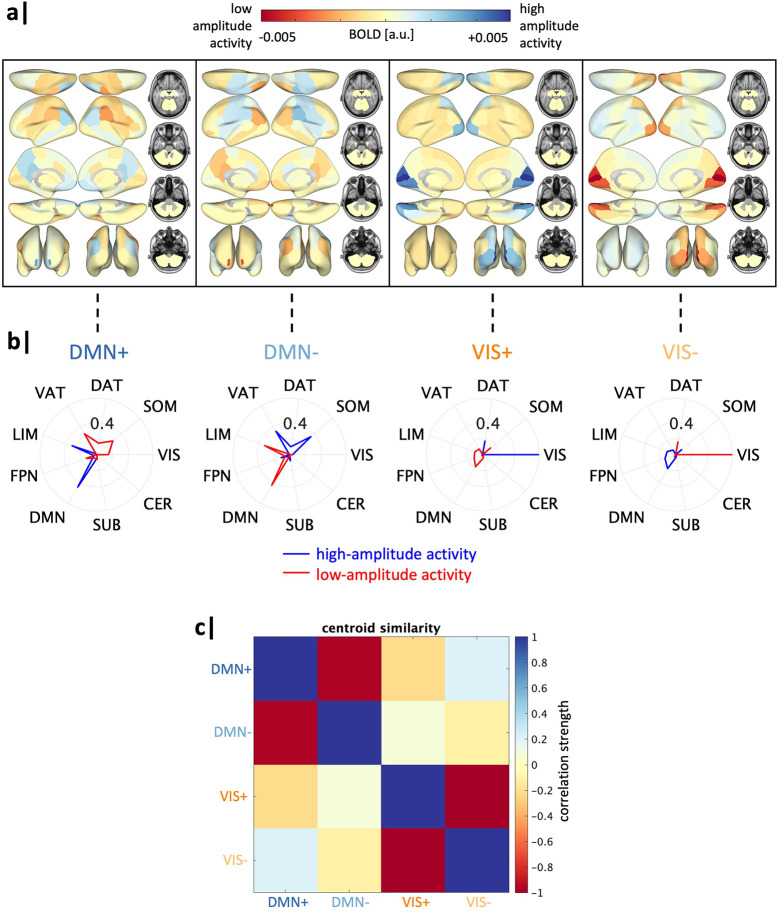
Figure 2. Global transition energy differences in family history of SUD vary by sex.
Four recurrent states of brain activity (brain states) identified via k-means clustering across all subjects. Group-average centroids are used for all illustrations. (a) Mean BOLD activation of each brain state plotted on the brain’s surface. a.u. = arbitrary units. (b) Cosine similarity with canonical resting-state networks (59) was calculated for the positive (high-amplitude) and negative (low-amplitude) components of each brain state’s group-average centroid separately. Each brain state is assigned the label of the network with the maximal cosine similarity value, with a sign indicating the maximal similarity was determined using high amplitude activity (+) or low amplitude activity (−). (c) Pearson correlation values between each pair of brain states. a.u. = arbitrary units, SUB = subcortical structures, CER = cerebellar structures, VIS = visual network, SOM = somatomotor network, DAT = dorsal attention network, VAT = ventral attention network, LIM = limbic network, FPN = frontoparietal network, DMN = default mode network.

