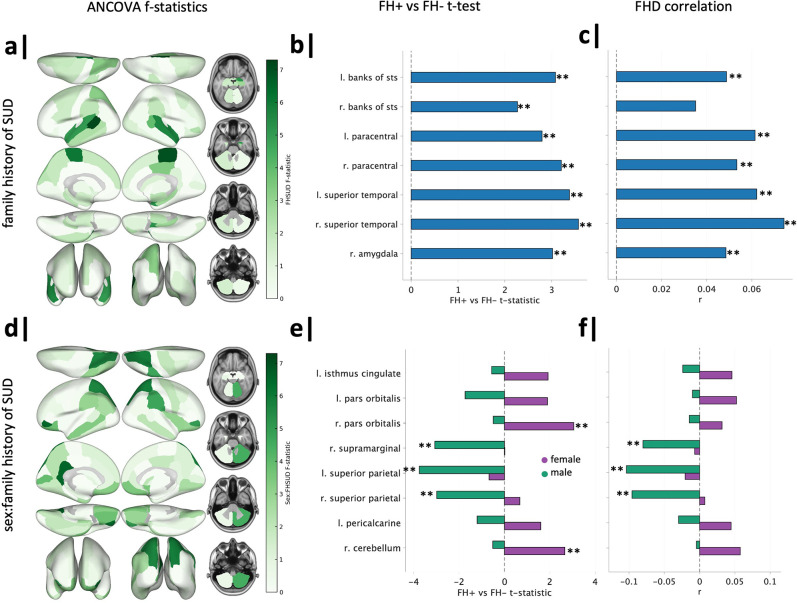
Figure 5. Regional transition energy differences in family history of SUD and family history of SUD by sex.
(a) ANCOVA of mean regional TE revealed significant effects of family history of SUD on seven regions, though they did not survive correction. (b) FH+ vs FH− t-tests revealed significant (post-correction across t tests of seven regions) FH+ > FH− across all seven regions. (c) Family history density had significant mild positive correlations with regional TE of all seven regions, except the right bank of STS. (d) ANCOVA of mean regional TE revealed significant effects of family history of SUD by sex in eight regions, though they did not survive correction. (e) Within-sex t-tests revealed FH+ females > FH− females in the right pars orbitalis and right cerebellum and FH+ males < FH− males in bilateral superior parietal lobules and right supramarginal gyrus (significant post-correction across t tests of eight regions). (f) Family history density had significant but weak negative correlations with regional TE of bilateral superior parietal lobules and right supramarginal in males. *significant before and **significant after correction.

