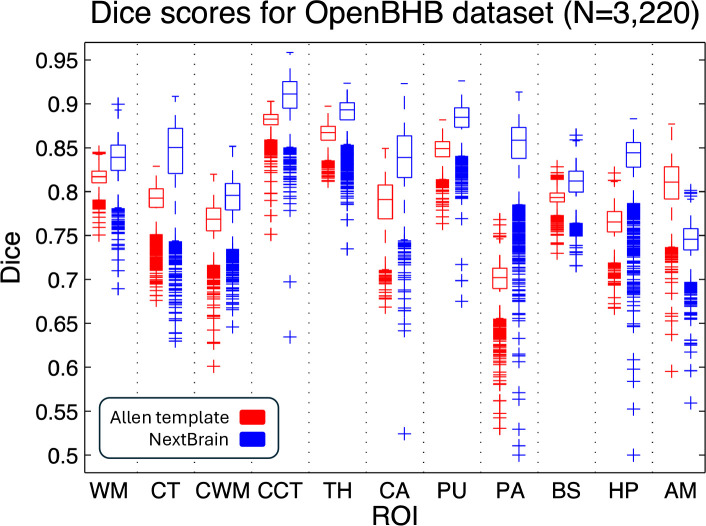
Extended Data Fig. 6:
Box plots of the Dice scores for 11 representative ROIs computed on the OpenBHB dataset (3,330 subjects), using the Allen MNI template and NextBrain, with FreeSurfer segmentations as reference. The scores are computed at the whole regions level, i.e., the level of granularity at which FreeSurfer segments. On each box, the central mark indicates the median, the edges of the box indicate the 25th and 75th percentiles, the whiskers extend to the most extreme data points not considered outliers, and the outliers are plotted individually as ‘+’. The abbreviations for the regions are: WM = white matter of the cerebrum, CT = cortex of the cerebrum, CWM = cerebellar white matter, CCT = cerebellar cortex, TH = thalamus, CA = caudate, PU = putamen, PA = pallidum, BS = brainstem, HP = hippocampus, AM = amygdala.

