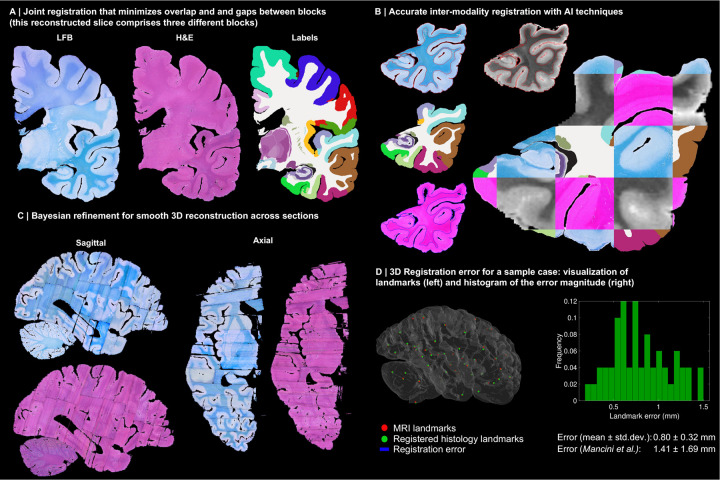
Extended Data Fig. 2:
3D reconstruction of Case 3. The visualisation follows the same convention as in Figure 3: (A) Coronal slice of the 3D reconstruction. (B) Registered MRI, LFB, and H&E histology of a block, with tissue boundaries (traced on LFB) overlaid. (C) Orthogonal view of reconstruction, which is smooth and avoids gaps and overlaps. (D) Visualization of 3D landmark registration error (left); histogram of its error (right); and mean ± standard deviation (bottom), compared with our previous pipeline (Mancini et al. [6]).

