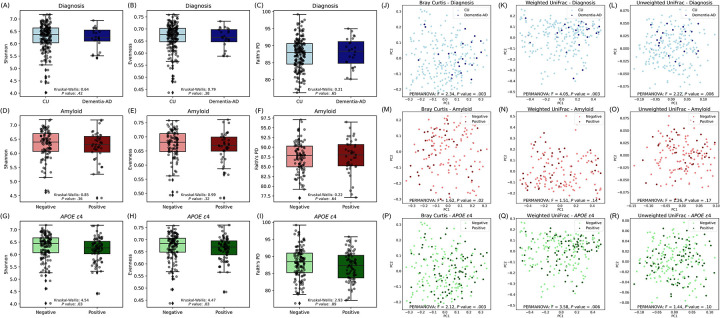
Figure 1. Alpha and beta diversity metrics across AD groups.
(A-C) Shannon, Evenness, and Faith’s PD metrics for individuals categorized by clinical diagnosis (CU vs. Dementia-AD). (D-F) Metrics for amyloid status (Negative vs. Positive). (G-I) Metrics across APOE ε4 status (Negative vs. Positive). Each box plot is overlaid with individual data points, enhancing visualization of the data distribution within each group. Kruskal-Wallis test was used to determine statistical significance. (J-L) Differences in beta diversity metrics (Bray Curtis, Weighted UniFrac, and Unweighted UniFrac, respectively) for individuals categorized by clinical diagnosis (CU vs. Dementia-AD). (M-O) Metrics for amyloid status (Negative vs. Positive). (P-R) Metrics across APOE ε4 status (Negative vs. Positive). Principal coordinates (PC)1 and PC2 axes represent the most variance in data. Each plot is color-coded by the respective group, highlighting the spatial distribution and clustering based on the dissimilarity indices. PERMANOVA was used to determine statistical significance.

