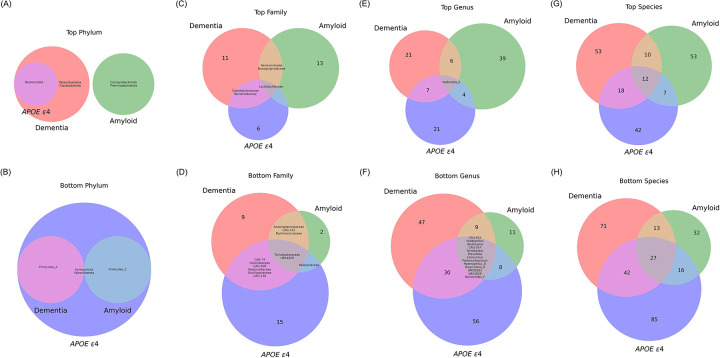
Figure 4. Venn-diagram of co-occurrence of microbial features across AD groups.
The diagrams on the left column (A, C, E, and G) depict the Top (positively-associated) differentially abundant features, while those on the right column (B, D, F, and H) show the Bottom (negatively-associated) differentially abundant features. (A and B) Top and Bottom microbial phyla, respectively. These diagrams identify unique and shared phyla associated with each of the three AD groups. (C and D) Top and Bottom microbial families, respectively. These diagrams highlight the family-level microbial differences that correlate with AD diagnosis, amyloid presence, and APOE ε4 genotype presence. (E and F) Top and Bottom microbial genera, respectively. These diagrams provide insight into the genus-level microbial composition influenced by the specified AD groups. (G and H) Top and Bottom microbial species, respectively. These diagrams detail the number of species that are unique and shared across the three AD groups. Each diagram contains colored regions representing intersections between the groups: red for dementia, green for amyloid, and blue for APOE ε4. The numbers within each segment of the diagrams indicate the count of microbial features unique to or shared between the conditions. Specific microbial features are listed in Table S2.

