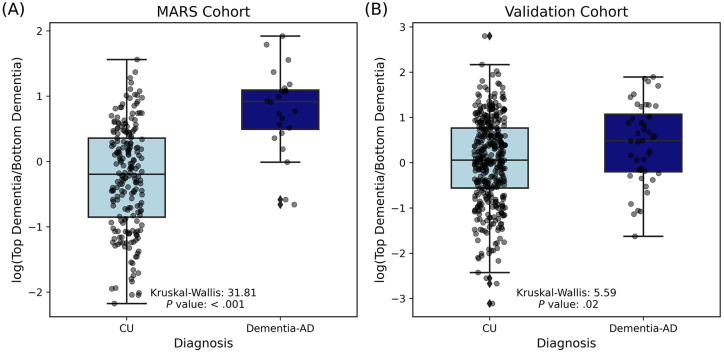
Figure 5. Comparison of log-transformed dementia biomarker ratios in CU and AD dementia across two cohorts.
(A) The results from the MARS cohort. Box plots show the distribution of log-transformed ratios of top dementia biomarkers to bottom dementia biomarkers for CU individuals (light blue) and AD dementia (dark blue) (Kruskal-Wallis = 31.81, P value < .001). (B) The results from a larger validation cohort (n = 448). Box plots present the distribution of log-transformed ratios of top dementia biomarkers to bottom dementia biomarkers found in the MARS cohort for CU individuals (light blue) and people with AD dementia (dark blue) (Kruskal-Wallis = 5.59, P value = .02). Each point represents an individual sample, with the boxes indicating the interquartile range (IQR) and the whiskers extending to 1.5 times the IQR. The horizontal line within each box denotes the median value.

