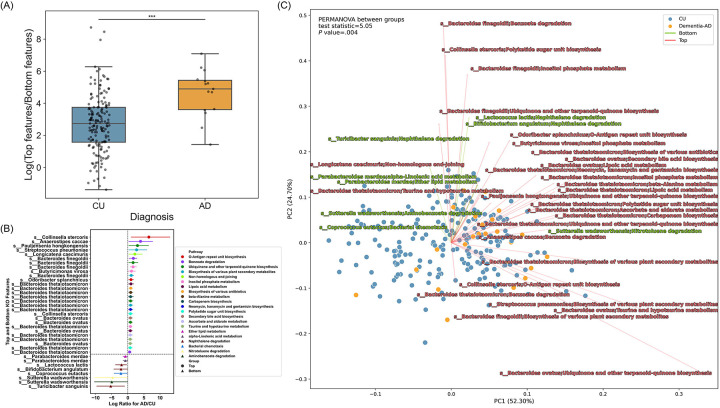
Figure 6. Differentially abundant microbial pathways between AD and CU.
(A) The distribution of the log ratios of Top/Bottom pathway features between AD (orange) and CU (blue) was shown in a box plot. Mann–Whitney U test was performed to determine statistical significance. Asterisks indicate a significant difference between AD (4.90) and CU (2.74) groups in the median of the log ratios of Top/Bottom pathway features (P value < .001). (B) A total of 36 differentially abundant features of microbial species and their corresponding pathways between AD and CU were displayed in a forest plot. Circles denote “Top” features, indicating a positive association with AD, whereas triangles denote “Bottom” features, indicating a negative association. The lines are color-coded by unique species and their corresponding pathways. DA analysis was conducted using BIRDMAn. (C) RPCA on the clinical diagnosis group and a biplot of microbiome pathway features and their corresponding species. Each point represents an individual sample color-coded by the respective group, with CU colored in blue and AD colored in orange. Vectors represent the direction (arrows) and magnitude (length) of the contribution of feature variables to the principal components (PCs). Vectors in red indicate Top features and vectors in green indicate Bottom features. PC1 and PC2 axes represent the most variance in data. Statistical analysis on RPCA was performed with PERMANOVA between AD and CU groups.

