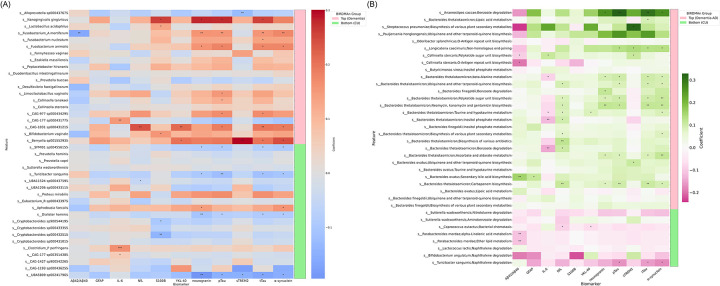
Figure 7. Heatmap illustrating the associations between gut microbiome compositional and functional features and CSF biomarkers in AD and related pathologies.
(A) This heatmap represents the coefficients of regression analysis between the top and bottom 20 gut microbial species linked to dementia and CSF biomarkers in two groups: Top (more abundant in AD, denoted by the pink bar) and Bottom (less abundant in AD, denoted by the green bar). The color scale indicates the strength and direction of the associations, with red representing positive associations and blue representing negative associations. The intensity of the color corresponds to the magnitude of the coefficient. Listed on the left are the gut microbiome species that were identified as more or less abundant in dementia-AD through BIRDMAn. (B) The heatmap depicts the coefficients of regression analysis between the gut microbial pathways and CSF biomarkers. Coefficients are scaled by colors indicating the strength and direction of the associations, with green representing positive associations and pink representing negative associations. The intensity of the color corresponds to the magnitude (strength) of the coefficient. Microbial species and their associated pathway features are listed on the left of the plot and two groups (Top: more abundant in AD, denoted by the light pink bar; and Bottom: less abundant in AD or more abundant in CU, denoted by the light green bar) from DA analysis using BIRDMAn are displayed on the right of the plot. The biomarkers listed along the bottom include amyloid pathology (Aβ42/Aβ40), tau pathophysiology (pTau181 and tTau), neurodegeneration (NfL), synaptic dysfunction and injury (neurogranin and α-synuclein), inflammation (IL-6), and glial activation (S100B, GFAP, YKL-40, and sTREM2). Asterisks indicate the level of statistical significance of the associations: ***P < .001, **P < .01, and *P < .05 (uncorrected).

