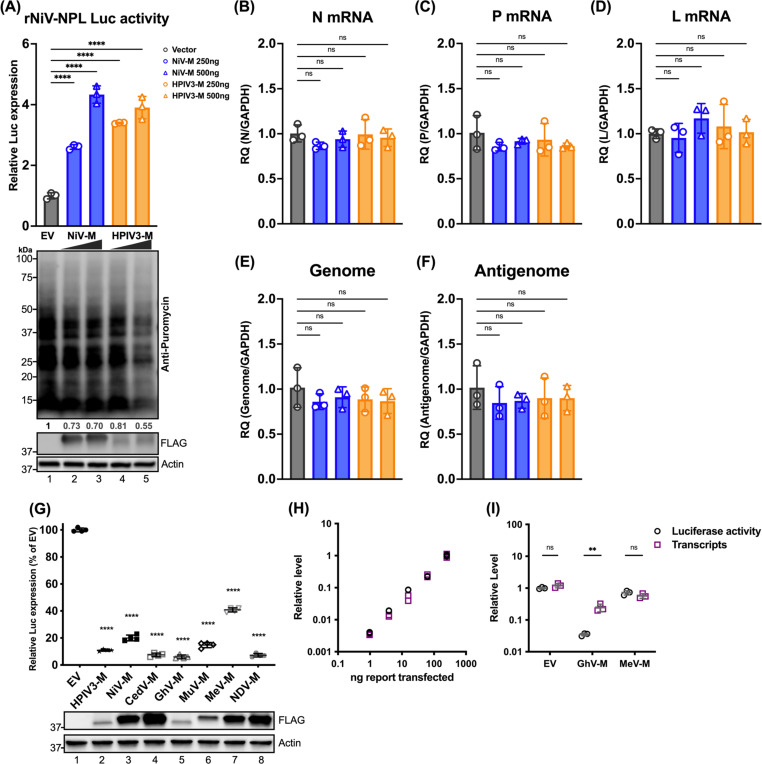
Figure 2. Effects of paramyxoviral-matrix on Nipah-NPL replicon and the expression of cellular splicing-dependent luciferase.
(A) HEK-293Ts were transfected with either NiV or HPIV3 matrix for 24 h. Following transfection, cells were inoculated with NiV-NPL replicon virus-like particles (VPL) and incubated for an additional 48 hours. Relative luciferase activity was measured using the Nano-Glo HiBiT system (upper panel). Puromycin-pulsed cells were analyzed by immunoblotting to assess protein expression levels (lower panel). (B-F) Total RNA was extracted from cells treated as in (A) and subjected to RT-qPCR. Relative viral transcript quantity (RQ) was normalized to GAPDH expression. (G) Luciferase activity (RLU) in HEK-293Ts co-transfected with paramyxoviral matrix protein and intron-containing luciferase reporters (Luc-I) for 24 h. RLU was detected using the ONE-Glo system. Expression of FLAG-fused matrixes was analyzed by immunoblotting. Relative luciferase expressions were normalized to EV. (H) A standard curve showing RLUs versus transcripts in HEK-293Ts transfected with varying amounts of Luc-I reporter (250 ng to 0.98 ng, 4-fold serial dilution). RLUs were measured using the ONE-Glo system, and transcript levels relative to 18S rRNA were determined by RT-qPCR. Relative levels were normalized to cells transfected with the maximum amount of Luc-I reporter. (I) Relative levels of RLU and transcripts in HEK-293Ts co-transfected with designated viral matrix and Luc-I reporter. RLUs and transcripts were measured as described in (H). With relative levels normalized to EV. Symbols are data points from biological triplicates. Bar represents the mean ± SD. Statistical significance was determined by one-way ANOVA with Dunnett multiple comparison test. ** P <0.01; **** P <0.0001; ns, not significant.

