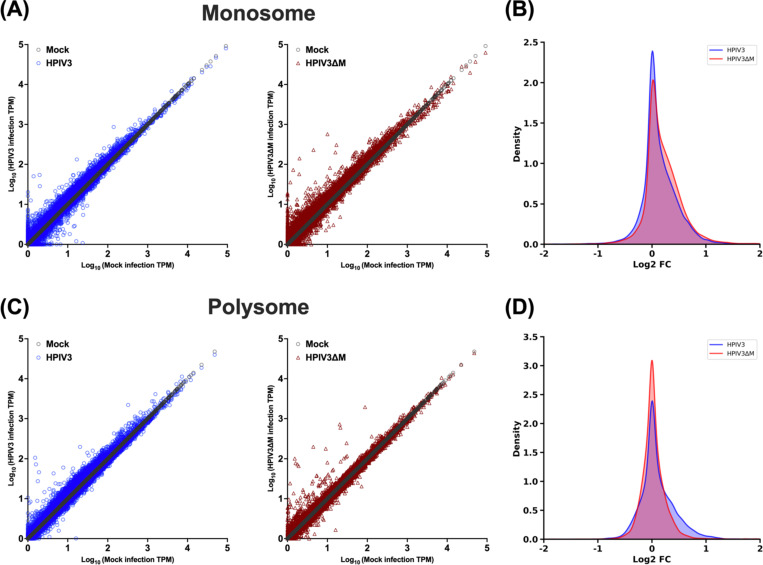
Figure 4. Effects of HPIV3 matrix on the relative abundance of individual cellular mRNAs between monosome and polysome.
(A) Scatter plots of transcripts per kilobase Million (TPM) for cellular mRNA transcripts in monosome fraction at 48 hpi. The x-axis graphed unique cellular mRNAs from mock-infected cells, and the y-axis depicted the corresponding TPM values for each mRNA in either mock-infected (gray circles), HPIV3-infected (blue circles) or HPIV3ΔM infected cells (red triangles). (B) Density plots of the log2 fold change in TPM for cellular mRNAs between virus-infected (HPIV3 or HPIV3ΔM) and mock-infected cells in monosome fraction. (C) Scatter plots of TPMs for cellular mRNA transcript in polysome fraction, presented as in A. (D) Density plots of the log 2fold change in TPM in polysome fraction, presented as in B.

