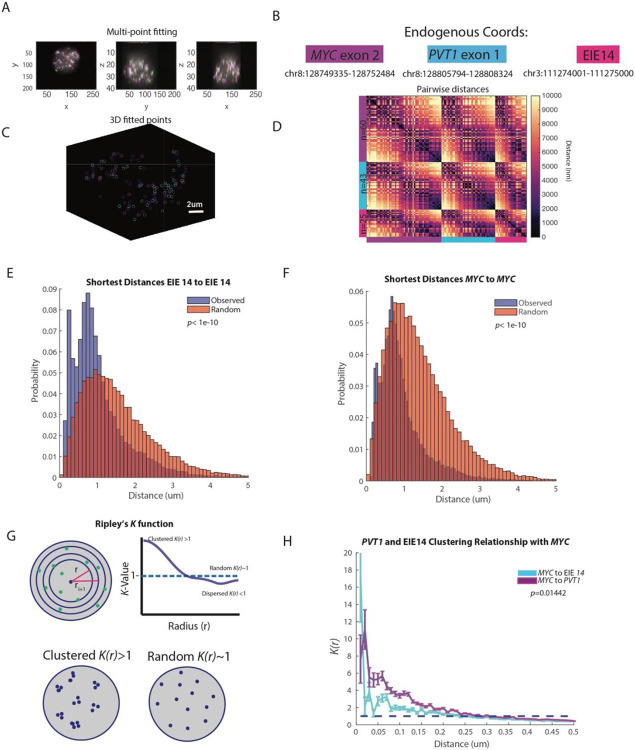
Figure 3: EIE 14 spatially clusters with MYC.
A. X, Y, Z projections of MYC exon (purple), PVT1 (blue), and EIE 14 (pink)
B. Endogenous coordinates of all three measured genomic regions.
C. Single cell projection of the 3D fitted points from (A).
D. Pairwise distances between MYC (purple), PVT1 (blue), and EIE 14 (pink) of a single cell. Number of fitted points per genomic region n=60, n=43, and n=25 respectively.
E. Histogram of distribution of distances of the observed shortest pairwise EIE 14 to EIE 14 distances and the expected shortest pairwise distances of points randomly simulated in a sphere (two-tailed Wilcoxon ranksum p<1e-10) of n=1329 analyzed cells.
F. As in (E) but for MYC to MYC shortest pairwise distances (two-tailed Wilcoxon ranksum p<1e-10).
G. Schematic of Ripley’s K function to describe clustering behaviors over different nucleus volumes. Top shows the nucleus divided into different shell intervals and how the K value is plotted for increasing radius (r). Bottom shows an example of what clustered K(r)>1 vs. random K(r)~1 points could look like. H. The average K(r) value across distance intervals of 0.01 to 0.5um in 0.02um step sizes to describe the clustering relationship of PVT1 and EIE 14 relative to MYC across different distance intervals (um). Error bars denote SEM. (Two-tailed Wilcoxon ranksum p=0.01442).

