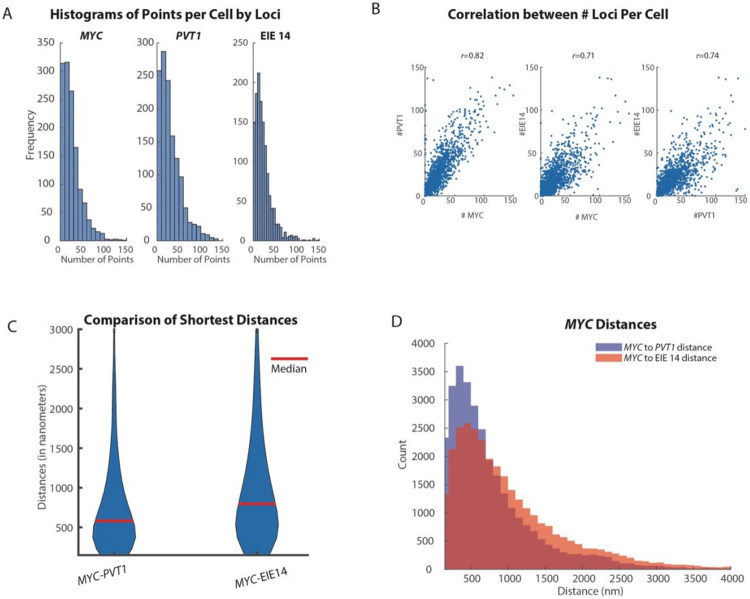
Extended Data Fig. 3:
A. Quantification of copy number of MYC, PVT1 and EIE 14 across all measured cells (n=1329). Mean copy number of MYC is 29 copies per cell, PVT1 is 31 copies per cell and EIE 14 is 22 copies per cell. Copies for all species ranged from 0 to 150 copies.
B. Correlation plots between the loci per cell. Pearson’s correlation coefficient calculated for PVT1-MYC r=0.82, EIE 14-MYC r=0.71, EIE 14-PVT1 r=0.74.
C. Violin plots of shortest distances of MYC to PVT1 and EIE 14 (median distance denoted by red line). Red line denotes median distance. C. Histogram of shortest distances of MYC to PVT1 (blue) and MYC to EIE 14 (orange) (Wilcoxon two-sided ranksum p=1.23e^-05).

