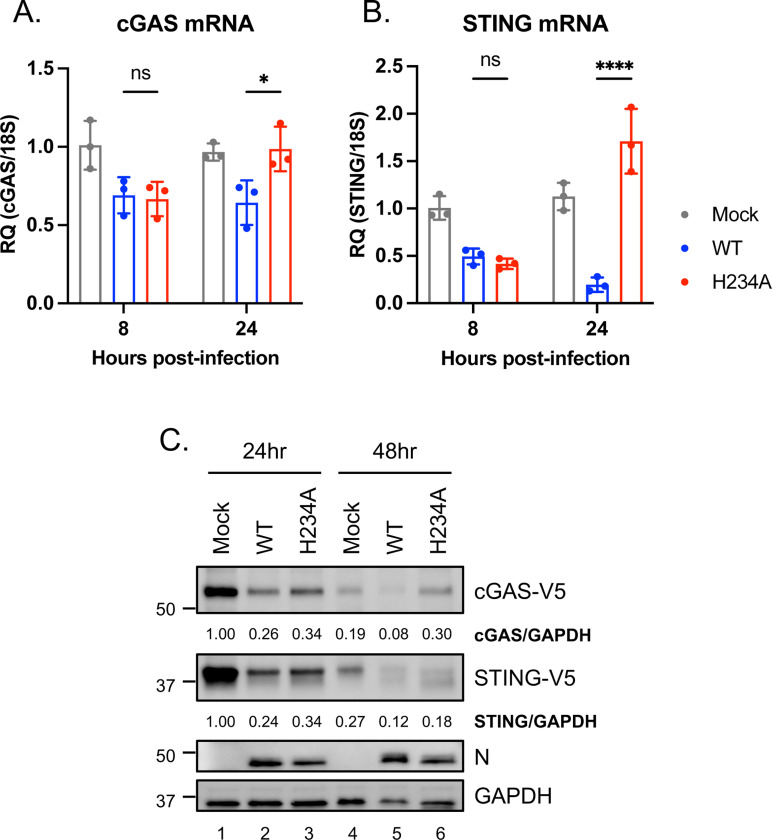
Fig. 4. Decrease in cGAS and STING during SARS-CoV-2 infection.
(A and B) Endogenous cGAS and STING mRNA levels in A549-ACE2 cells uninfected or infected with Nsp15WT and Nsp15H234A rSARS-CoV-2 at MOI of 5 for 8 or 24 h. RT-qPCR results are presented relative to the expression of 18S rRNA. Data are mean ± SD (n = 3) and analyzed by two-way ANOVA with Tukey’s multiple comparison test. * P≤0.05; **** P≤0.0001; ns, not significant. (C) BHK-ACE2 cells were mock infected or infected with Nsp15WT and Nsp15H234A rSARS-CoV-2 at MOI of 0.1, further transfected with cGAS and STING plasmids at 4 hpi. At 24 and 48 hpi, cell lysates were harvested for clarifying the indicated protein levels.

