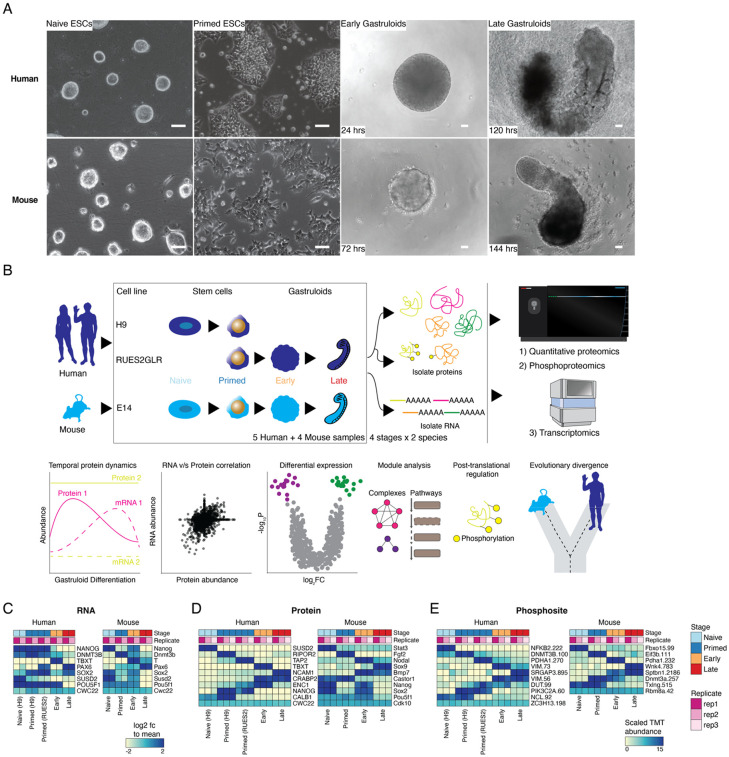
Figure 1. Quantifying the dynamic proteome from ESCs to gastruloids.
(A) Representative brightfield images of human RA-gastruloids and mouse gastruloids imaged over the course of their development. Scale bar: 10 μm. (B) Multi-omics profiling workflow. We sampled two human cell lines (H9 and RUES2-GLR) and one mouse cell line (E14) at the indicated stages. (C-E) Representative heatmaps depicting the temporal dynamics of RNAs (C), proteins (D), or phosphosites (E) for selected developmental marker transcripts, proteins or PTMs, respectively, across replicates and stages for both human and mouse. Color scale for RNAs indicates log2-fold change relative to the row mean. Color scale for protein and phosphorylation data indicates scaled TMT abundance.

