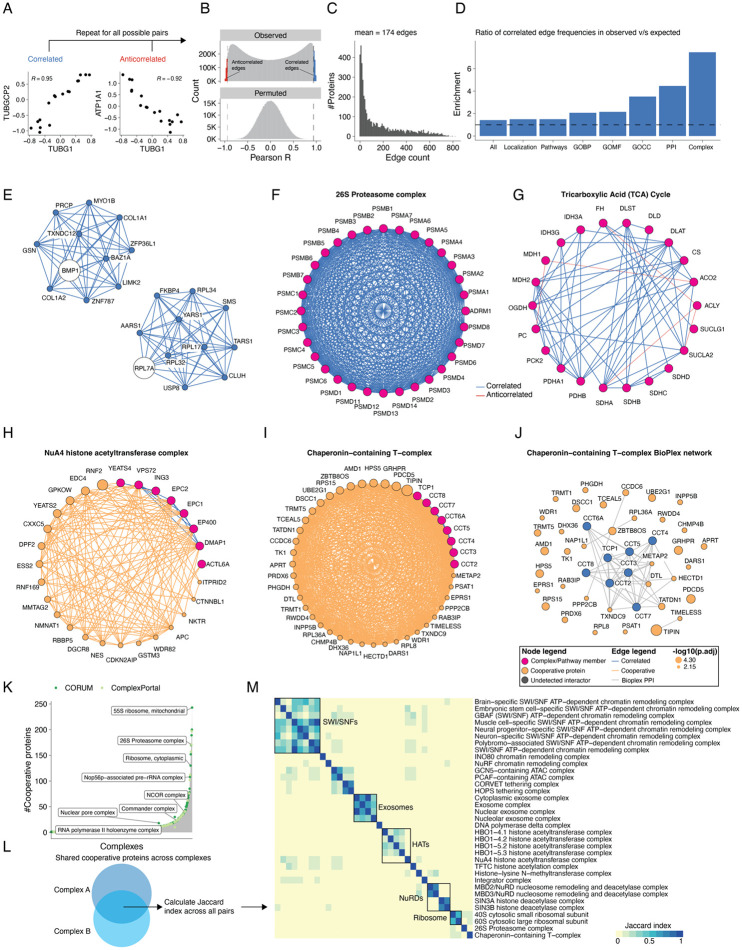
Figure 3. Co-regulation analysis maps cooperative protein associations to known protein complexes and pathways.
(A) Scatterplots comparing abundances across selected protein pairs across samples. (B) Distribution of rPearson based on observed (top) and permuted (bottom) data. Observed distribution was obtained by calculating rPearson across all possible protein-protein pairs. Permuted distributions were generated by randomly sampling 50,000 protein pairs after randomly shuffling their respective timepoints 10 times each prior to calculating rPearson. Colors indicate strongly correlated (>=0.95; blue) or anticorrelated (<=−0.95; red) edges. (C) Distribution of protein edge counts across the trimmed correlation network. On average, each protein in the network participated in 174 edges. (D) Ratio of enrichment for the annotated edges in the correlation network (“observed network”) compared to the expected edge annotation frequencies across Gene Ontology biological process (GOBP), cellular component (GOCC), molecular function (GOMF), localization, pathways, protein-protein interactions (BioPlex) or protein complexes. Specifically, we calculated the enrichment for annotated edges as the fraction of annotated edges per category in the observed correlation network divided by the fraction of annotated edges among all possible edges involving the 5,227 proteins in the correlation network. The expected frequency of annotated edges was calculated by generating all possible pairs from 5,227 human proteins (Uniprot, 07/2024) and computing the number of pairs explained by each functional category. (E) Network analysis identifies known associations between proteins for BMP1 and RPL7A. (F-G) Network structure of the (F) 26S proteasome and (G) Citric Acid cycle pathway. Magenta nodes indicate known complex members annotated either from CORUM or EMBL ComplexPortal for protein complexes, or from BioCarta, KEGG, Protein Interaction Database (PID), Reactome, and WikiPathways (WP) for biochemical pathways. Blue edges indicate positive correlations between nodes while red edges indicate anticorrelations. (H-I) Cooperative proteins are highly correlated with members of established protein complexes including: (H) NuA4 chromatin remodeling complex and (I) Chaperonin-containing T (TRiC/CCT) complex. Magenta nodes indicate subunits of a given complex, while orange nodes indicate cooperative proteins i.e. proteins with correlated profiles to proteins constituting a particular protein complex. Cooperative node sizes indicate the negative log10 of the BH-adjusted p-value after computing significance from Fisher’s exact tests to determine cooperative association of a protein to a particular module. Blue edges indicate correlated edges while orange edges link cooperative proteins to members of a particular module. (J) Bioplex interaction network of the TRiC/CCT complex. Orange nodes are cooperative proteins with correlated profiles to proteins found in the TRiC/CCT complex. Gray edges indicate BioPlex evidence. (K) Histogram of protein complexes (x-axis) and their respective numbers of cooperative proteins (y-axis). (L) Heuristic to identify shared cooperative proteins between complexes. (M) Heatmap depicting a subset of shared cooperative proteins across manually curated EMBL ComplexPortal protein complexes namely exosomes, SWI/SNFs, ATAC remodelers, nucleosome remodelers (NuRDs), and histone acetyltransferase (HAT) and deacetylase (HDAC) complexes. Heatmap colored by Jaccard similarity coefficients calculated from overlapping sets of cooperative proteins between protein complex pairs and clustered using euclidean distances with average linkage.

