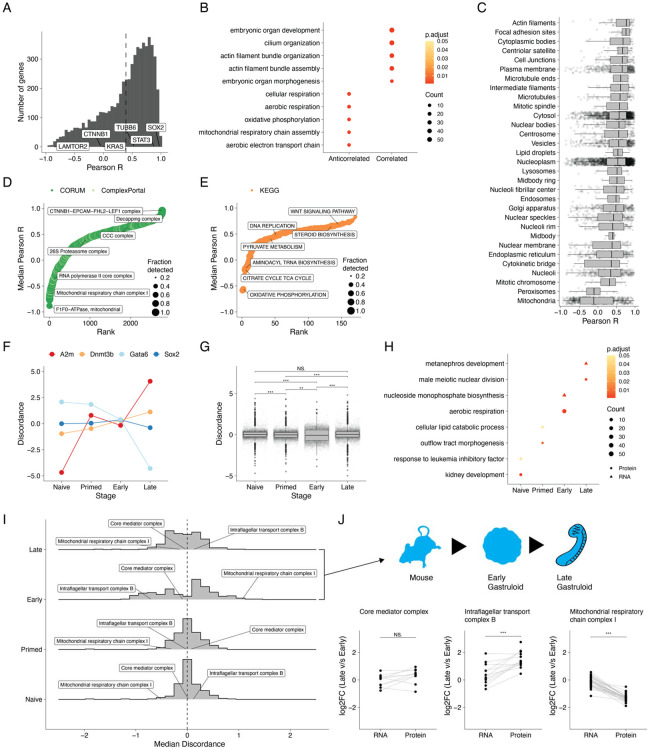
Figure 4. Gastruloid stages and gene modules exhibit varying degrees of RNA-protein discordance.
(A) Histogram of correlations (rPearson) between protein and RNA expression for all genes detected at the transcript and protein level in our samplings of human and mouse gastruloid development. Dashed line indicates the mean rPearson across all genes. Representative genes with varying extents of correlation are highlighted. (B) GO term dotplot highlighting GO-defined biological processes exhibiting high RNA-protein correlation (rPearson >= 0.75) or anticorrelation (rPearson <= −0.75). (C) Boxplot depicting the distribution of protein-RNA correlation (x-axis) as a function of subcellular location (y-axis). Rank plots of median RNA-protein rPearson across (D) protein complexes or (E) biochemical pathways. Colors indicate databases from which the module sets were curated. (F) Representative examples of RNA-protein discordance profiles (for any given gene, mean across replicate is shown) for various stages. (G) Boxplot depicting the distributions of RNA-protein discordances (for any given gene, mean across replicates is shown) for various mouse stages. (H) Dotplot highlighting the biological processes significantly enriched in genes exhibiting protein-abundant (circles; discordance >=1) or RNA-abundant (triangles; discordance <=−1) RNA-protein discordance. Color scale indicates the p-value adjusted using the Benjamini-Hochberg procedure and sizes of dots indicate the number of genes detected within each term. (I) Median RNA-protein discordances of members of protein complexes at each stage of mouse gastruloid development. (J) Comparison of the RNA and protein log2-scaled fold-changes between early vs. late mouse gastruloids in the Mediator complex (left), intraflagellar transport complex B (middle), and mitochondrial Complex I of the oxidative phosphorylation pathway. Significance testing on RNA and protein distributions was performed using a standard t-test.

