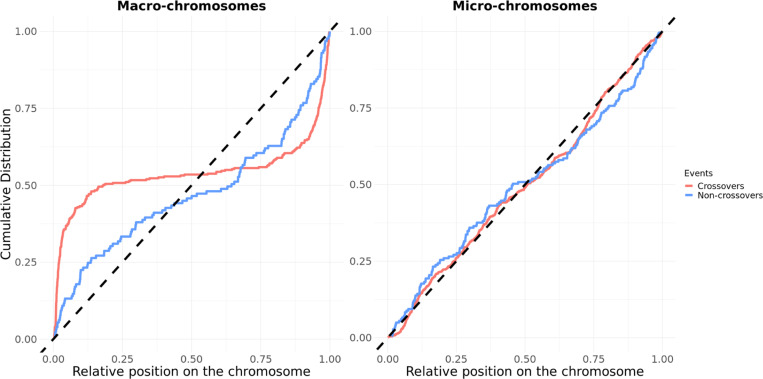
Fig 2. Cumulative distribution of recombination events along both types of chromosomes.
The cumulative distribution of crossovers (in red) and non-crossovers (in blue) on the autosomes, for macro-chromosomes (left) and micro-chromosomes (right). Macro-chromosomes are defined as autosomes longer than 40 Mb. The position of the events is normalized by the length of the chromosome (see Method). The black dashed lines represent the uniform distribution. S10 Fig shows similar results, separating micro-chromosomes above and below 20 Mb in length. S6 Table reports p-values from Kolmogorov-Smirnov tests for various comparisons (crossover versus non-crossover, macro versus microchromosomes).

