
Fig 3. Overlap of both types of recombination events with CpG islands.
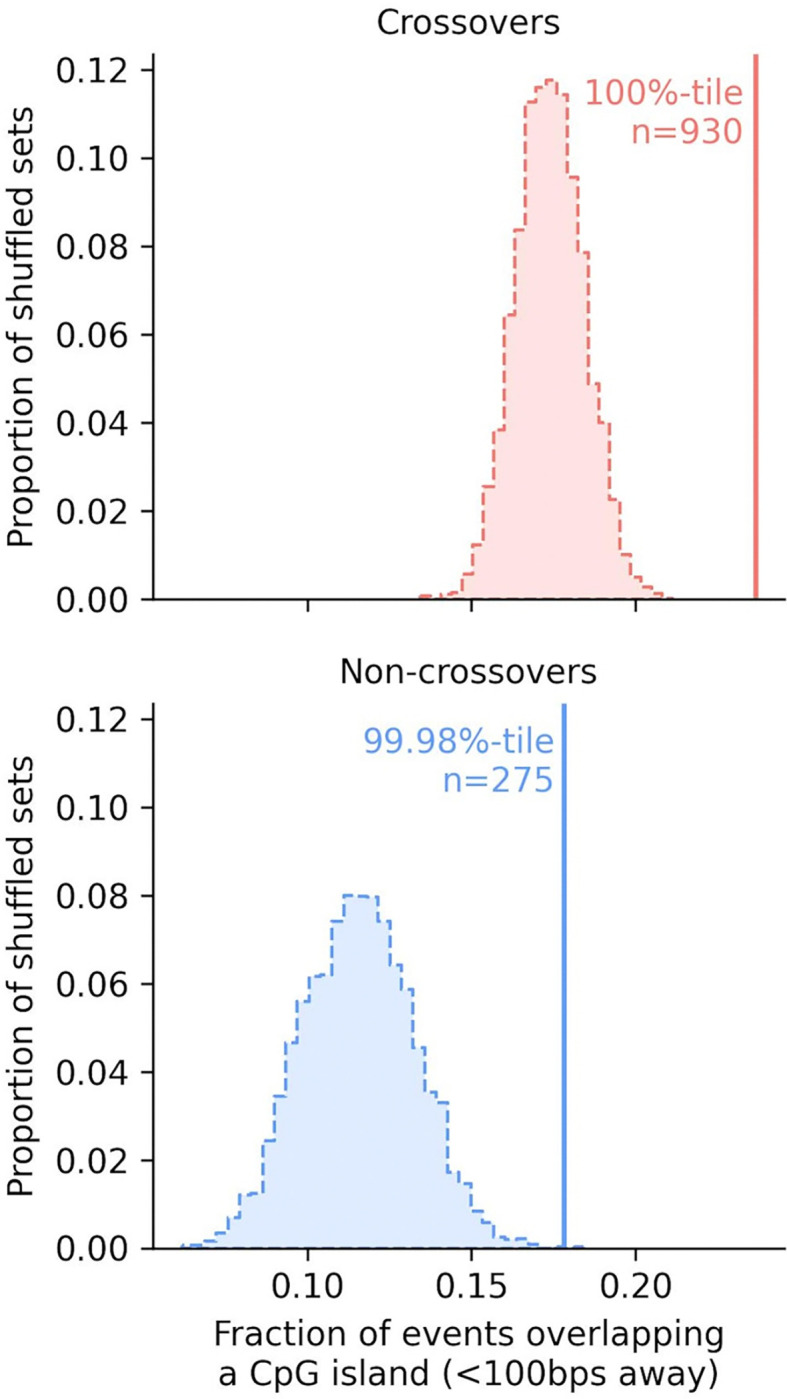
Fractions of crossovers (top) and non-crossovers (bottom) within 100 bps of a CpG island. The vertical lines show the observed overlap. The distribution for the overlap expected by chance is shown as a histogram, obtained by randomly shuffling all the events within a 2.5 Mb window on each side of their original location, matching for the GC content and ensuring similar mappability (see Methods for details).