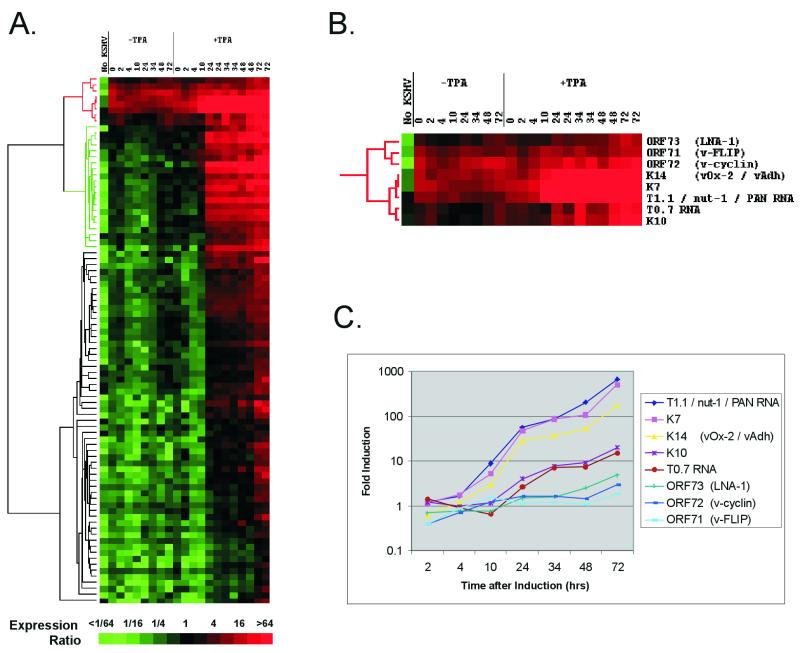
FIG. 2.
(A) Hierarchical clustering of gene expression data. Each row represents a separate amplicon on the array; each column represents the results from one array, hybridized with the sample detailed above. Columns 2 to 8 (−TPA) show untreated cells at successive time points shown in hours; lanes 9 to 21 (+TPA) show time points after the induction of lytic replication with TPA. Two independent experiments were conducted for the 24-, 34-, 48-, and 72-h time points for TPA induction. Column 1 (No KSHV) shows the array results from Ramos cell RNA, a KSHV-negative B-cell line. Levels of expression are relative to double the median level of expression for all genes averaged over all uninduced samples. The magnitude of this ratio is color coded according to the scale; shades of red signify detectable expression, and shades of green illustrate expression below the baseline level. The dendrogram on the left represents similarities of patterns of gene expression. The branch colored green is discussed in the text. (B) Expanded view of the uppermost cluster (red in panel A), which represents genes whose expression is detectable in uninduced cells. (C) Fold increase in expression at each time point (relative to time zero) after the induction of lytic replication with TPA. The genes form the cluster shown in panel B. The values are relative to the mean of the two time zero samples, with the values for 24, 34, 48, and 72 h being the averages of two experiments.

