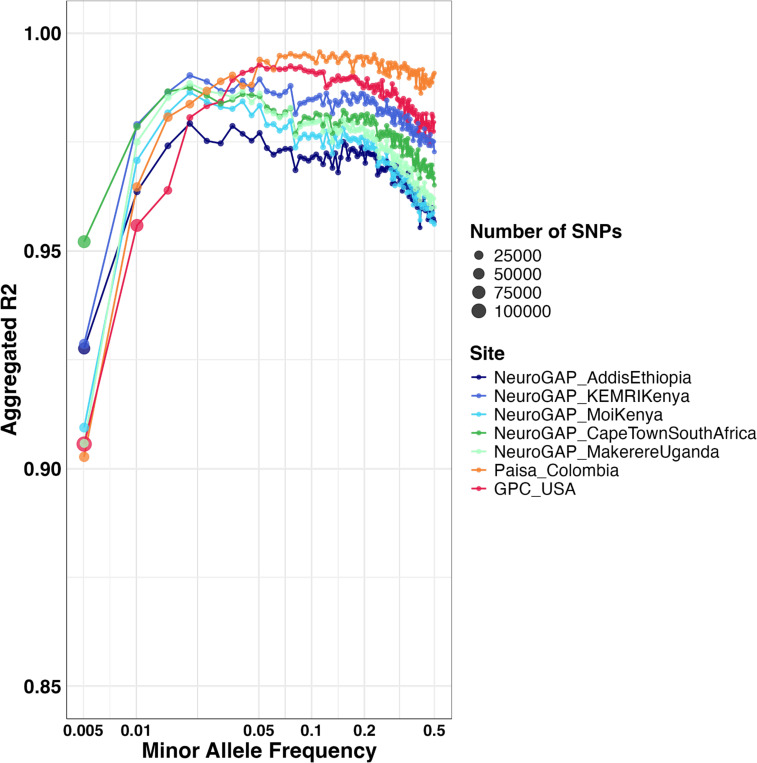
Figure 3: Imputation of BGE data is highly concordant with GWAS array data across MAF bins.
The sizes of points correspond to numbers of SNPs in each MAF bin. Variants are filtered to those passing an INFO score >= 0.8. SNP MAFs are defined within cohorts using the GSA array for the Paisa and GPC cohorts. Due to limited GSA samples in the NeuroGAP cohorts, MAFs are defined using the HGDP+1kGP AFR subset.16

