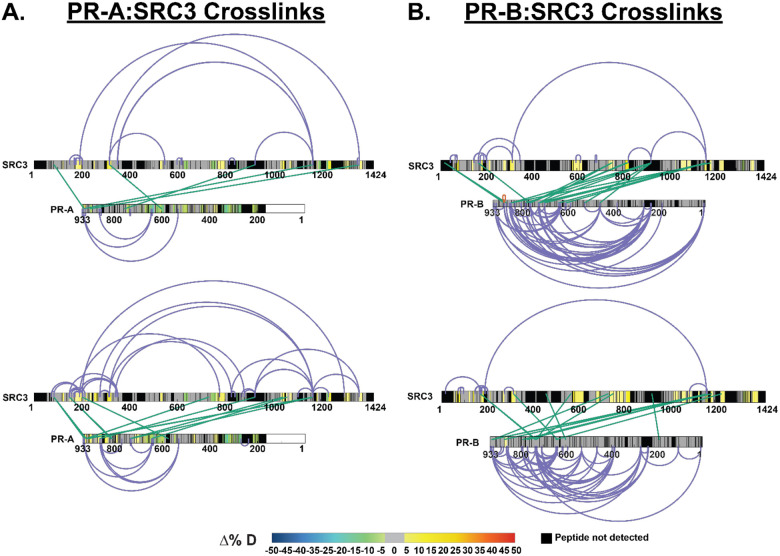
Extended Data Fig. 2. PR and SRC3 deuterium exchange differences align with crosslinking results.
A. XiView images of differential XL-MS data for PR-A vs. PR-A:SRC3 experiments with crosslinks enriched in apo samples (top) and pre-bound samples (bottom) represented. HDX overlays are indicative of their comparable differential HDX-MS experiments. Top: SRC3 exchange - SRC3 vs. PR-A:SRC3 (non-DNA bound), PR exchange – PR-A vs. PR-A:SRC3. Bottom: SRC3 exchange – SRC3 vs. PR-A:SRC3:PRE, PR exchange – PR-A:SRC3 vs. PR-A:SRC3:PRE. B. XiView images of differential XL-MS data for PR-B vs. PR-B:SRC3 experiments with the same HDX overlays as shown in A. Intraprotein crosslinks are represented in purple, interprotein crosslinks are represented as green. Differential HDX-MS scale shows the % change in deuterium incorporation, where cooler colors represent reduced deuterium exchange, while warmer colors (yellow, orange, red) represent increased deuterium exchange. Black represents peptides not detected in HDX-MS experiments, and PR isoforms have numbering normalized to the B isoform.

