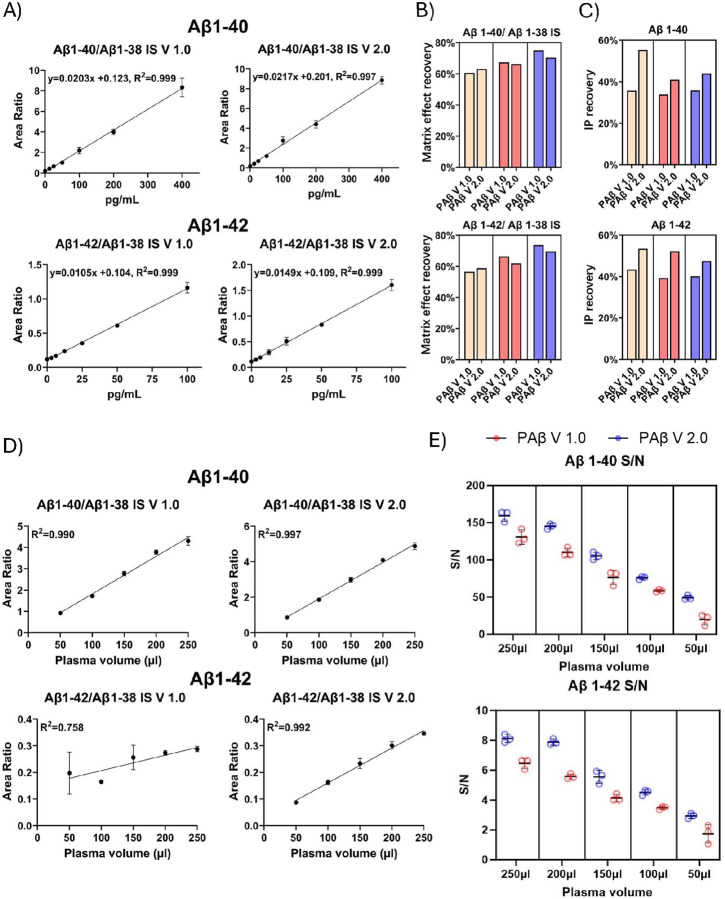
Figure 4. Analytical performance assessment of the IP-MS assays.
(A) The calibration curves were generated using Aβ1–40 concentrations of 400pg/ml, 200pg/ml, 100pg/ml, 50pg/ml, 25pg/ml, 12.5pg/ml, and 0pg/ml, and Aβ1–42 concentrations of 100pg/ml, 50pg/ml, 25pg/ml, 12.5pg/ml, 6.25pg/ml, 3.125pg/ml, and 0pg/ml, normalized with Aβ1–38 IS. (B) The matrix effect recovery was assessed across three different concentrations, each with three replicates, utilizing Aβ1–38 IS normalization. (C) The IP recovery was measured through the SIMOA assay. (D) The relationship between plasma dilution and normalized intensity of the PAβ V1.0 and PAβ V2.0 assays. Three replicates were performed for each volume. Both Aβ1–40 and Aβ1–42 were normalized by Aβ1–38 IS. (E) The S/N ratios of plasma samples with various volumes were compared between PAβ V1.0 and PAβ V2.0 assays for Aβ1–40 and Aβ1–42.

