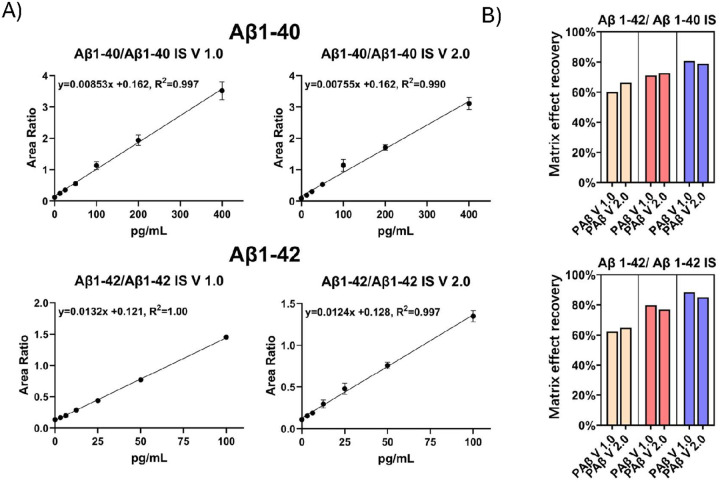
Figure 5. Calibration curve and matrix effect recovery assessment using Aβ1–40 IS and Aβ1–42 IS normalization.
(A) The calibration curves were generated using Aβ1–40 concentrations of 400pg/ml, 200pg/ml, 100pg/ml, 50pg/ml, 25pg/ml, 12.5pg/ml, and 0pg/ml, and Aβ1–42 concentrations of 100pg/ml, 50pg/ml, 25pg/ml, 12.5pg/ml, 6.25pg/ml, 3.125pg/ml, and 0pg/ml, normalized with Aβ1–40 IS and Aβ1–42 IS. (B) The matrix effect recovery was assessed across three different concentrations, each with three replicates, utilizing Aβ1–40 IS and Aβ1–42 IS normalization.

