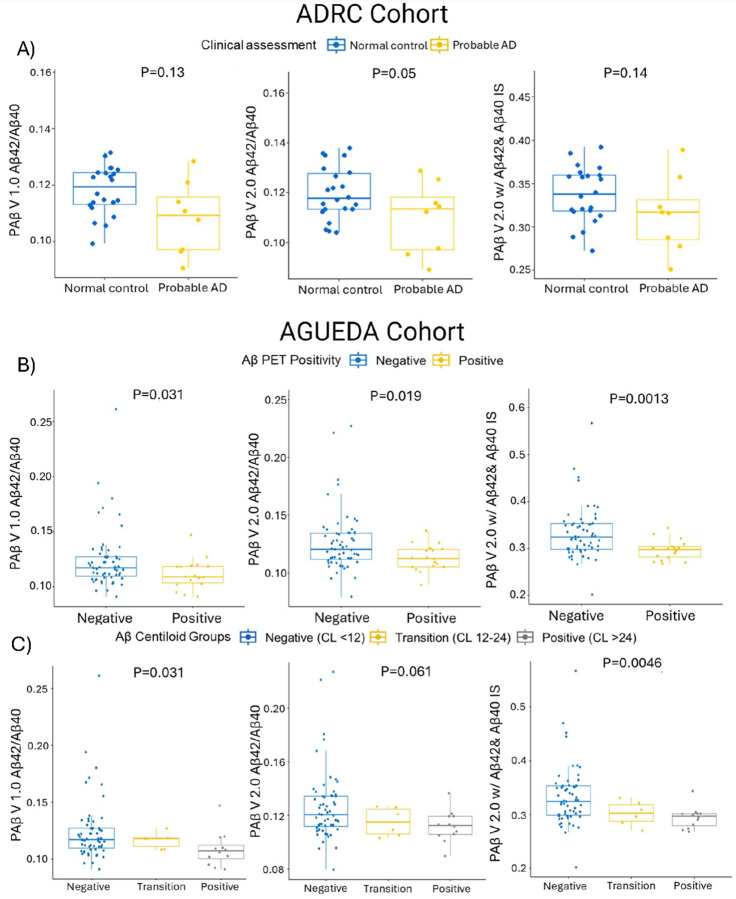
Figure 6. Clinical performance of plasma Aβ biomarkers.
(A) Box and whisker plot categorizes the ADRC cohort into clinically assessed probable AD and normal control groups, analyzed using the Wilcoxon Rank Sum test, with p-values indicated. N represents the sample size. (B) Box and whisker plot shows the AGUEDA cohort split into Aβ PET positive and PET negative groups, analyzing three assay formats: PAβ V1.0 assay Aβ1–42/Aβ1–40, PAβ V2.0 assay Aβ1–42/Aβ1–40, and PAβ V2.0 assay Aβ1–42/Aβ1–40 normalized with Aβ1–40 IS and Aβ1–42 IS. Differences between groups were evaluated using the Wilcoxon Rank Sum test, with p-values provided. (C) Box and whisker plot dividing the AGUEDA cohort into CL positive, CL transition, and CL negative groups, with differences assessed using the Kruskal-Wallis test and p-values noted.

