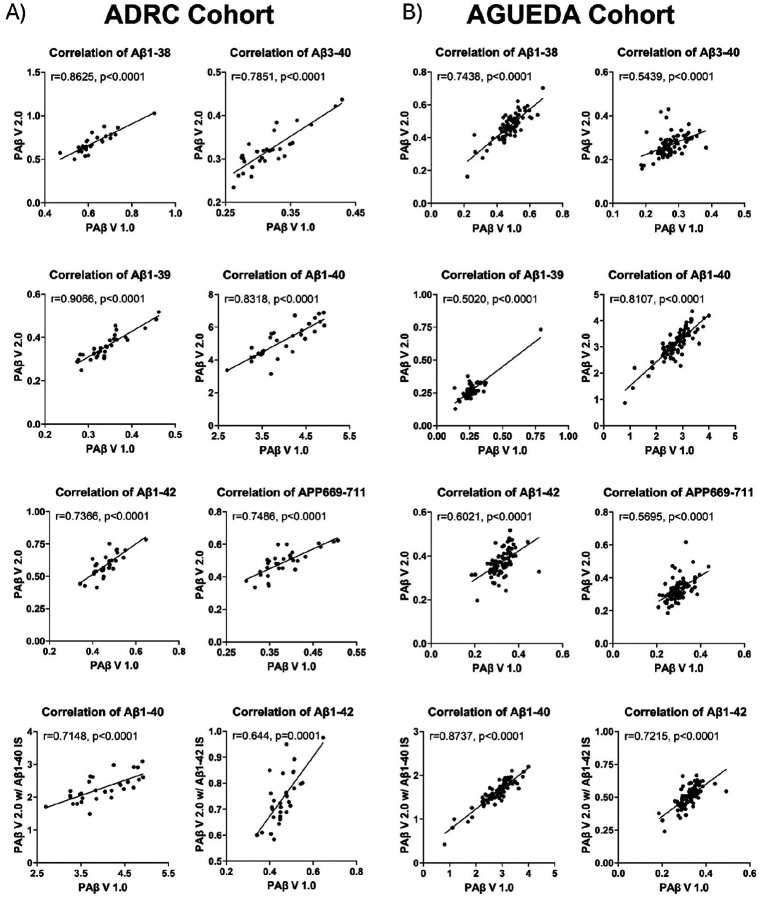
Figure 7. Correlation tests of PAβ V1.0 and PAβ V2.0 assays.
The correlation between the PAβ V1.0 assay and PAβ V2.0 assay, normalized using Aβ1–38 IS, was illustrated for the ADRC (A) and AGUEDA (B) cohorts. Spearman correlation was employed to evaluate the strength of the correlation between Aβ peptide measurements across the two assays. Additionally, Aβ1–40 and Aβ1–42, normalized using Aβ1–40 IS and Aβ1–42 IS in the PAβ V2.0 assay, were further assessed for correlation with their respective Aβ peptides in the PAβ V1.0 assay, normalized using Aβ1–38 IS.

