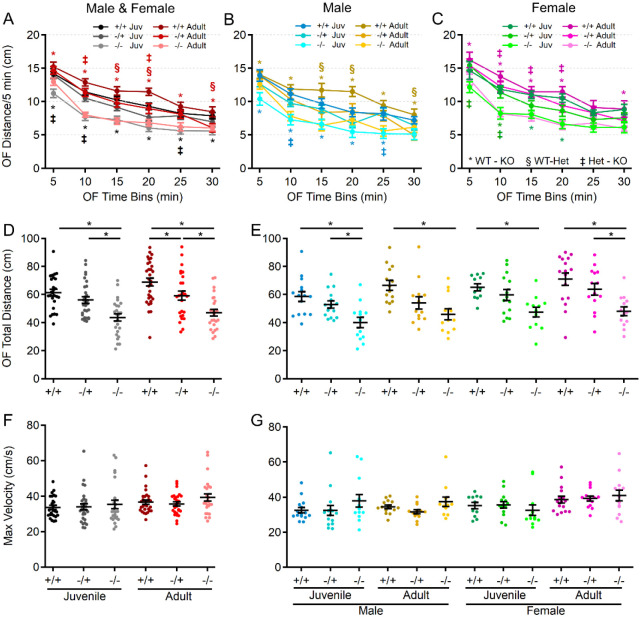
Figure 2. Juvenile and adult shank3Δex4−22 KO mice display reduced exploratory and locomotion behavior.
(A-C) Mean ± SEM of the total distance moved within each 5 min period of open field exploration for each genotype at both ages (A) and further separated into males (B) and females (C) at each age. (D-G) Individual animal (circles) and group mean ± SEM (black bars) of the total cumulative distance moved (D, E) and maximal linear movement velocity detected (F, G) during open field exploration for each genotype at both ages (D, F) and further separated by sex (E, G). N = 22–30 mice/group for each genotype at each age and N = 10–16 mice/group for each sex within each genotype at each age. In open field distance time plots (A-C), symbols correspond to p<0.05 in post-hoc comparison of genotypes within age and/or sex: * WT-KO, ‡ Het-KO, and § WT-Het, while *p<0.05 in scatter dot-mean plots (D-G) in post-hoc comparisons between genotypes, all with a Bonferroni correction.

