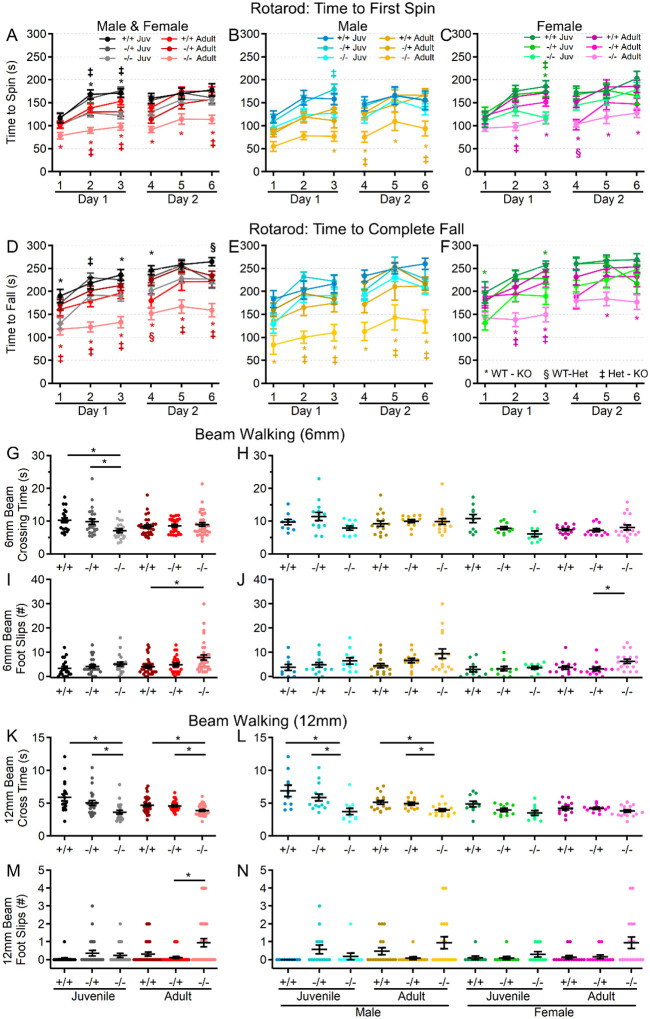
Figure 3. Shank3Δex4−22 KO mice develop motor function deficits with age.
(A-F) Mean ± SEM of the time until the mouse rotates completely around the rotarod (A-C) or falls to the landing platform (D-F) for three subsequent accelerating rotarod tests (4–40 RPM, 5 min) repeated over two days total for each genotype at both ages (A, D) and further separated into males (B, E) and females (C, F) at each age. (G-N) Individual (circles) and mean ± SEM (black bars) of the time to cross (G, H, K, and L) and the number left and right total foot slips (I, J, M, and N) on a 6mm wide (G-J) and 12mm wide (K-N) beam for each genotype at both ages (G, I, K, and M) and further separated by sex (H, J, L, and N). N = 20–35 mice/group for each genotype at each age and N = 10–18 mice/group for each sex within each genotype at each age. In open field distance time plots (A-F), symbols correspond to p<0.05 in post-hoc comparison of genotypes within age and/or sex: * WT-KO, ‡ Het-KO, and § WT-Het, while *p<0.05 in scatter dot-mean plots (G-N) in post-hoc comparisons between genotypes, all with a Bonferroni correction.

