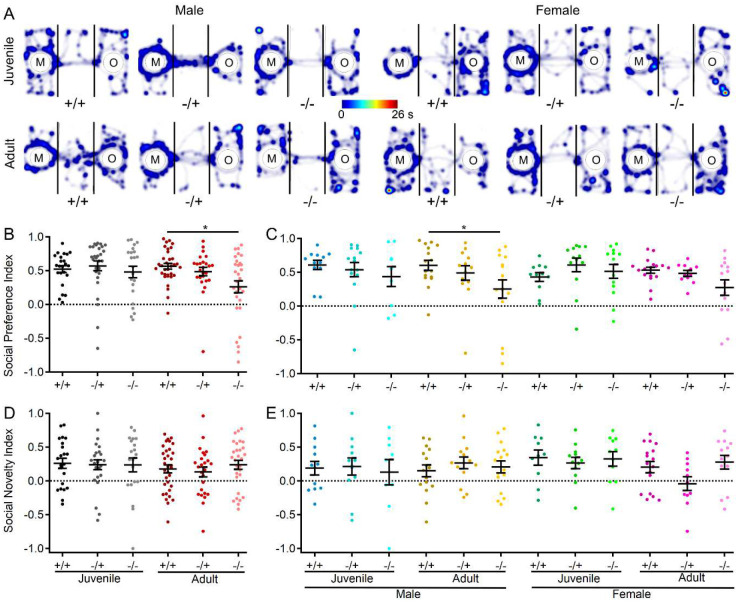
Figure 6. Male shank3Δex4−22 KO mice develop reduced social preference with age in the three-chamber sociability assay.
(A) Representative heatmaps of time spent in each area of the three-chamber arena for one mouse of each genotype, age, and sex. The color scale bar at center applies to all heatmaps in the A. (B-E) Individual (circles) and mean ± SEM (black bars) of the social preference index (B, C) and social novelty index (D, E) for each genotype at both ages (B, D) and further separated by sex (C, E). N = 23–33 mice/group for each genotype at each age and N = 9–17 mice/group for each sex within each genotype at each age. *p<0.05 for post-hoc test between genotypes with a Bonferroni correction.

