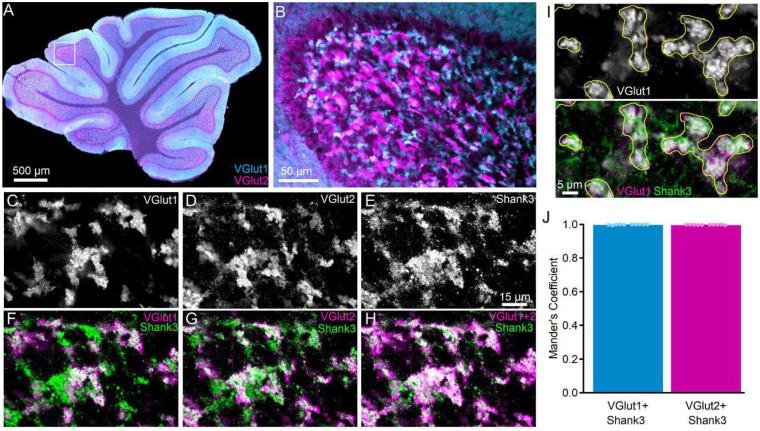
Figure 7. SHANK3 is expressed at CGC dendrites around VGlut1- and VGlut2-positive mossy fibers (MF) terminals.
(A, B) Confocal fluorescence images at 4x (A) and 20x (B) demonstrating expression of VGlut1 (cyan) and VGlut2 (magenta) throughout the internal granule cell layer at mossy fiber terminals. (C-H) Grayscale (C-E) and pseudocolor (F-H) 60x confocal fluorescence single plane images of the same image location in the internal granule cell layer in parasagittal sections labeled with VGlut1, VGlut2, and SHANK3. Fluorescence color is assigned to enhance contrast in comparing magenta and green. (F-H) SHANK3 is expressed around VGlut1- and VGlut2-expressing terminals. (I) Example of how VGlut1-positive (white, top) terminals were used to define ROIs (yellow) for SHANK3 colocalization analysis. (J) Individual (circles) and mean ± SEM (bars) Mander’s coefficient for each analyzed image reflect similar colocalization of SHANK3 at VGlut1- and VGlut2-expressing mossy fibers. VGlut1-expressing (281 terminals) and VGlut2-expressing (285 terminals) were evaluated from n = 10 images per mossy fiber marker from N = 5 C57bl/6J mice.

