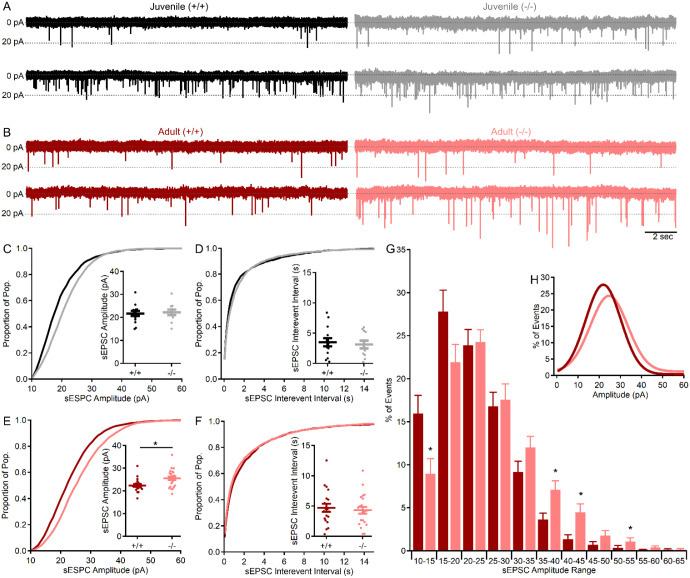
Figure 8. MF–CGC sEPSC amplitude is augmented in adult mice lacking shank3ex4–22.
(A, B) Representative (20 sec) traces of CGC sEPSCs (in 10μM gabazine) recorded from two genotypes each juvenile (A, black, gray) and adult (B, red, light red) wildtype (+/+) and knockout (−/−) shank3Δex4−22 mice. Each trace is from a different CGC. (C-F) Cumulative distribution histograms for all events for each group with corresponding inset individual (circles) and mean ± SEM (bars) for sEPSC amplitudes (C, E) and interevent intervals (D, F) from juvenile (C, D) and adult (E, F) wildtype (+/+) and knockout (−/−) shank3Δex4−22 mice. (G) Average normalized (to total event number) distribution histogram for sEPSC values from each CGC with the gaussian fit of the averaged distribution provided in the inset (H). n = 19 – 22 cells/genotype from N = 11 – 14 adult mice and n = 11 – 14 cells/genotype from N = 6 – 9 juvenile mice. For comparison of mean group sEPSC values (C-F insets) or averaged sEPSC histogram bin percentages (G) *p<0.05 for t-test between genotypes.

